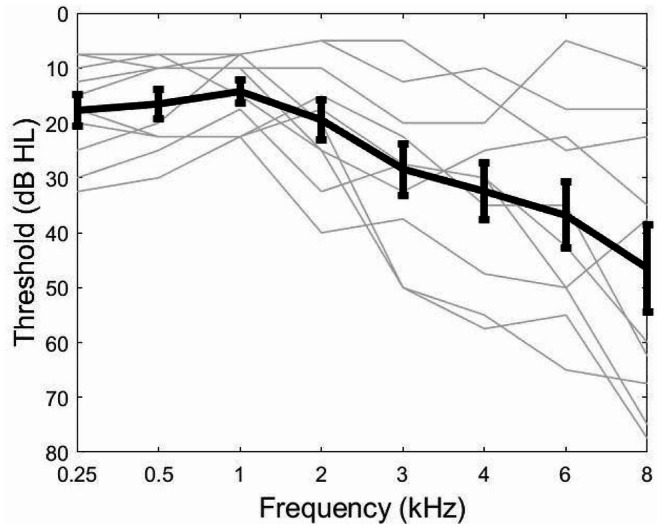
Fig. 1.

Audiograms of participants averaged across the two ears. Grey lines show the thresholds of individual participants and the black line show the thresholds averaged across participants. Error bars indicate the standard errors of the means

Audiograms of participants averaged across the two ears. Grey lines show the thresholds of individual participants and the black line show the thresholds averaged across participants. Error bars indicate the standard errors of the means