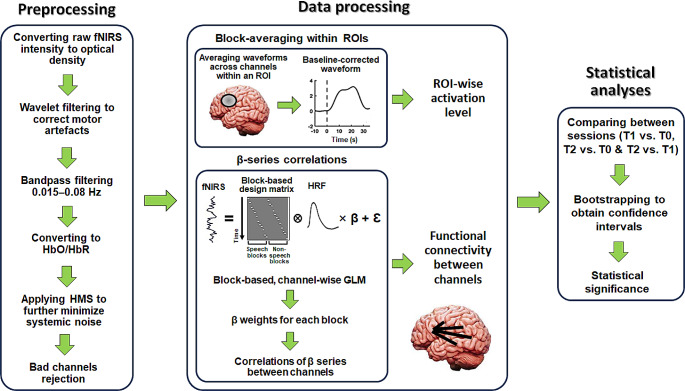
Fig. 3.
Flow charts for signal processing. The raw fNIRS data were first preprocessed. This included conversion fNIRS intensity to optical density, motor artefact correction (via wavelet filtering), bandpass filtering, conversion to HbO and HbR, and applying haemodynamic modality separation (HMS). Bad channels were finally detected via scalp coupling index (SCI) and were rejected for subsequent analyses. The preprocessed data were then used to measure functional activation levels and connectivity for each task (auditory and visual) during each session (T0, T1 and T2). Activation levels were measured via normalised response magnitudes by block-averaging within ROIs. Functional connectivity was measured by correlations of block-based beta-weight (through GLM) series between individual channels. Statistics were finally conducted using bootstrapping to obtain confidence intervals based on comparisons of activation levels and connectivity between different sessions for each task. Details of the entire procedure are described in the main text

