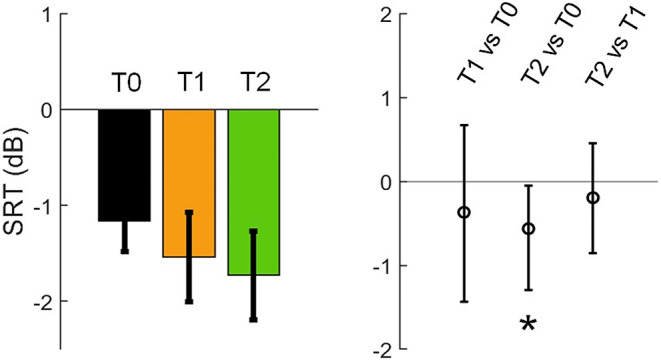
Fig. 4.

Speech-in-noise performances (SRT; lower SRT reflects better performance) across sessions. Left panel: SRTs at T0, T1 and T2. Error bars indicate standard errors of the means. Right panel: changes across sessions (T1 vs. T0, T2 vs. T0 and T2 vs. T1) with mean values indicated by circles in the middle and error bars indicating 95% confidence intervals (significance level α corrected at 0.05/3). The asterisk indicates statistical significance where zero is outside the confidence interval
