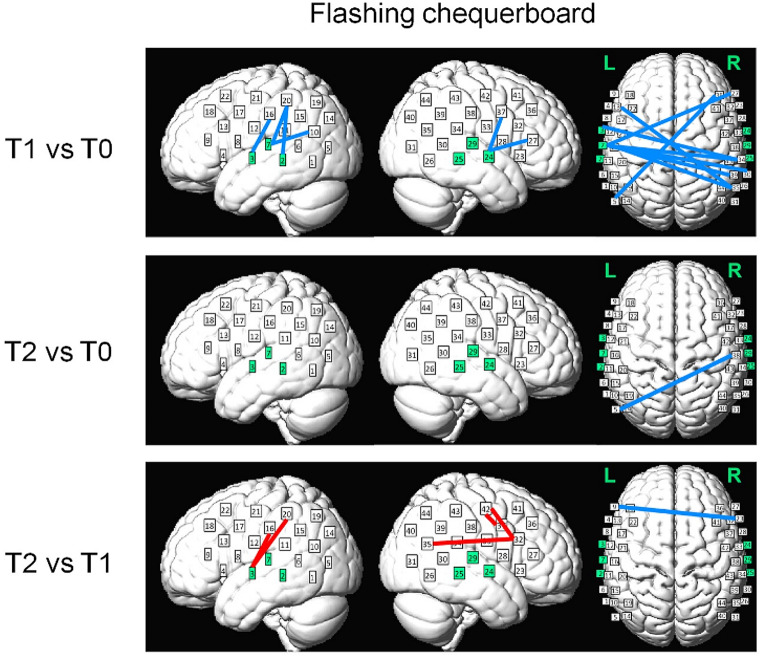
Fig. 6.
Changes in functional connectivity during the visual test across sessions (T1 vs. T0, T2 vs. T0 and T2 vs. T1). In each panel, significant changes (α corrected at 0.05/(964*3)) in intra- and inter-hemispheric connectivity are shown respectively (from left to right). The red and blue lines indicate the enhancement/increases and decreases in connectivity, respectively. Major changes were decreased connectivity between auditory and non-auditory cortices immediately after training (T1 vs. T0). Channels on the left and right auditory cortices (Channels 2, 3, 7, 24, 25 and 29) are highlighted in green

