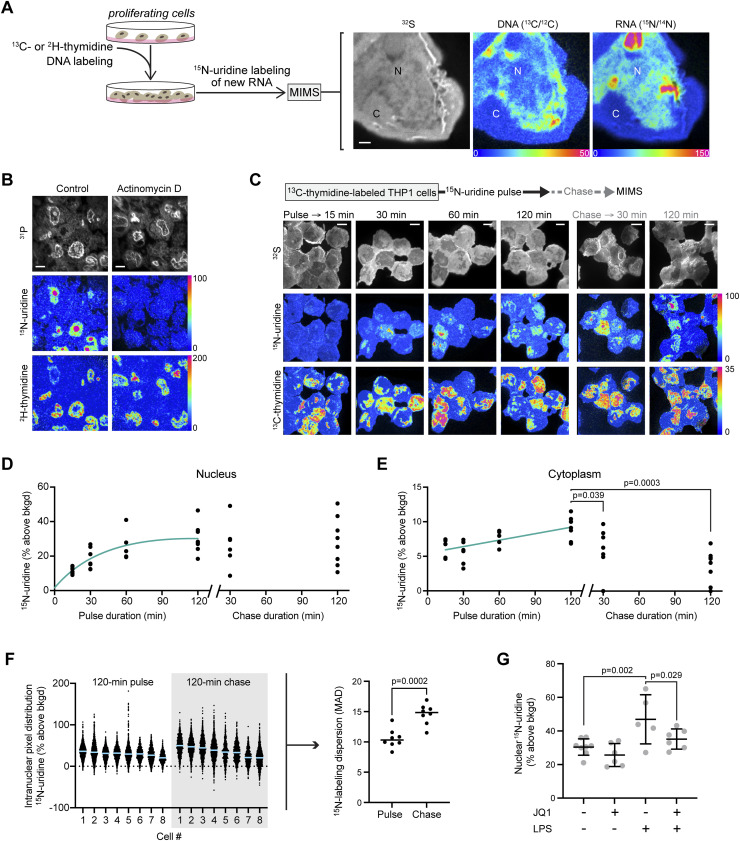
Figure 1. Multi-isotope imaging mass spectrometry demonstrates intranuclear heterogeneity of new RNA synthesis.
(A) Strategy for multiplexed measurement of new RNA and DNA architecture. 13C- or 2H-thymidine was administered to proliferating cells during serial passage to saturate DNA labeling, followed by pulse labeling with 15N-uridine as a tracer for new RNA. Cells were analyzed by multi-isotope imaging mass spectrometry with a representative example shown of a THP-1 cell administered with 15N-uridine for 60 min. 32S− images show histological details, including cellular contours, the nucleus (N), and the cytoplasm (C). Hue, saturation, and intensity images display isotope ratio measurements, quantitatively mapping DNA labeling (13C/12C) and new RNA labeling (15N/14N). The lower bound of the scale is set to the background ratio (0%), and the upper bound is set to reveal differences in labeling (50% and 150% above background, respectively). Scale bar: 1 μm. (B) 2H-thymidine–labeled THP-1 cells pulsed with 15N-uridine for 120 min with/without RNA synthesis inhibitor (actinomycin D). 31P mass images (top) show nuclei in a pattern qualitatively similar to DAPI because of the high phosphorous content of chromatin. Scale bar: 5 μm. (C) 15N-uridine pulse-chase labeling of THP-1 cells. Scale bar: 5 μm. (D) Nuclear quantification of 15N-uridine pulse-chase labeling. (E) Cytoplasmic quantification of 15N-uridine pulse-chase labeling: pulse compared with chase timepoints by ANOVA with Dunnett’s adjusted P-values shown. (F) Isotope ratio data for intranuclear pixels from 120-min pulse and 120-min chase cells. Left: pixel distribution dot plots with mean line. Right: statistical metric of dispersion (median absolute deviation, MAD) for the pixel distributions with P-value reported for an unpaired t test. (G) Mean nuclear 15N-uridine labeling (120 min) in THP-1 cells stimulated with lipopolysaccharide and/or the bromodomain inhibitor (JQ1), with significance assessed by two-way ANOVA for overall lipopolysaccharide effect (P = 0.0009) and JQ1 effect (P = 0.023). Individual P-values for multiple comparisons are provided in the figure.

