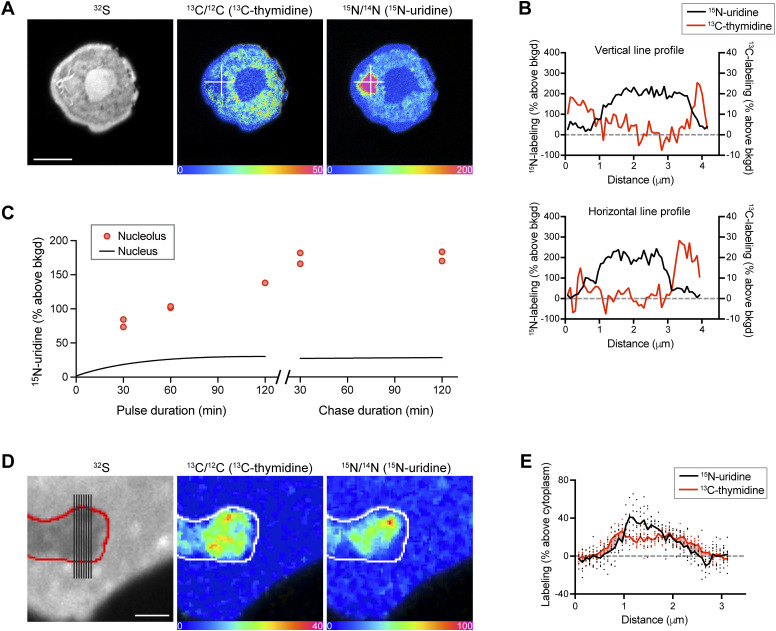
Figure 2. Multiplexed mapping of DNA density and new RNA reveals intranuclear transcriptional organization.
(A) THP-1 cell after 120 min of 15N-uridine labeling. The nucleus has a ring shape in the imaging plane. The intense 15N-uridine signal is seen with the stereotypical size and appearance of a nucleolus. Horizontal and vertical lines shown in the images were used to generate line profiles shown quantitatively in (B). Scale bar: 5 μm. (B) Line profiles for 15N-uridine (black) and 13C-thymidine (red) labeling and demonstrating inverse relationship. (C) 15N-uridine pulse-chase labeling of THP-1 nucleoli (dots) relative to the mean signal for the nucleus (black line). (D) Nuclear protrusion was captured en face in THP-1 cells. Lines shown in the 32S image (far left) were used to generate line data shown in (E). Scale bar: 2 μm. (E) Lines shown in 32S image in (D) were used to generate parallel data points from the cytoplasm through the nuclear protrusion and back to the cytoplasm, capturing two transitions across the nuclear membrane and quantitatively showing the lag in new RNA labeling in the DNA at the nuclear membrane. See Fig S3 for additional analyses of labeling at the nuclear lamina.

