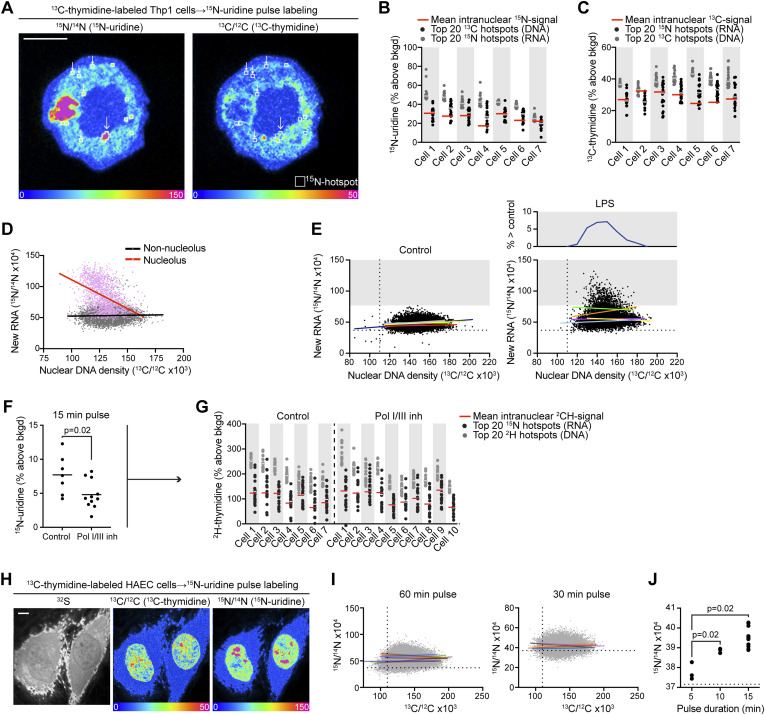
Figure 3. Detection of new RNA synthesis across the spectrum of DNA density.
(A) Hotspots of new RNA labeling were generated using an automated function in OpenMIMS software (top 20, 4 × 4 pixels). A subset of 15N-uridine hotpots localized to regions of low DNA labeling (small arrows), whereas others localized to regions of high DNA labeling (large arrow). This cell is the same as that shown in 2A but imaged at greater depth demonstrating the appearance/disappearance of these small puncta in the vertical axis. (B, C) Automated hotspot generation was applied to additional cells in (B, C). Scale bar: 5 μm. (B) 15N labeling distributions for 13C-DNA hotspots and 15N-RNA labeling hotspots (n = top 20). A subset of DNA hotspots demonstrates new RNA labeling above the mean of the nucleus (red line) and overlapping with the most intense RNA hotspots. (B, C) Complementary analysis to (B) showing 13C labeling distributions for 13C-DNA hotspots and 15N-RNA hotspots (n = top 20). A subset of RNA hotspots exhibited a DNA concentration that is above the mean of the nucleus (red line) and overlapping with the most intense DNA hotspots. (A, D) Pixel-level correlations for the images shown in (A) demonstrating an inverse correlation between RNA and DNA labeling intensity in the pixels contained in the nucleolus (slope = −0.92; R2 = 0.20; P < 0.0001) and a slightly positive but nearly flat correlation for pixels in the non-nucleolar regions of the nucleus (slope = 0.03; R2 = 0.001; P< 0.0004). (A, E) Non-nucleolar pixel correlations were generated for THP-1 cells labeled with 15N-uridine for 120 min as in (A). The pixels are merged, but each cell’s linear correlation is shown with a different rainbow color. Left: control cells. Right: lipopolysaccharide-stimulated cells. The gray block identifies the range above the highest labeled pixel in the control cells and shows recruitment of new RNA with lipopolysaccharide stimulus across the spectrum of DNA concentration. Like unstimulated cells, there was no consistent correlation between the DNA and RNA signals. (F) 2H-thymidine–labeled THP-1 cells were pulse-labeled with 15N-uridine for 15 min. To isolate RNA Pol II activity, cells were administered with inhibitors of RNA polymerase I/III (BMH-21 + CAS 577784-91-9 at 1 μM), which attenuated new RNA, one-way ANOVA, and Sidak’s multiple comparison test. (G) Hotspots of new RNA synthesis were mapped with the extraction of corresponding 2H-thymidine labeling intensity. 2H labeling distributions for 2H (DNA) hotspots and 15N-RNA hotspots (n = top 20). A subset of RNA hotspots exhibited a DNA concentration above the mean of the nucleus (red line) and overlapping with intense DNA hotspots. This was observed in both control cells and cells administered with Pol I/III inhibitors. (H) 13C-thymidine–labeled human aortic endothelial cells were pulse-labeled with 15N-uridine; representative cells labeled for 60 min are shown. Scale bar: 5 μm. (I) Non-nucleolar pixel correlations were generated for human aortic endothelial cells after 60 or 30 min of pulse labeling with 15N-uridine. (J) 15N-RNA labeling of the top 5% of DNA-labeled pixels in human aortic endothelial cells after 5, 10, or 15 min of 15N-uridine pulse labeling. The dashed line is the measured isotope ratio for an unlabeled cell, which is at the natural background ratio of 37 (x10−4).

