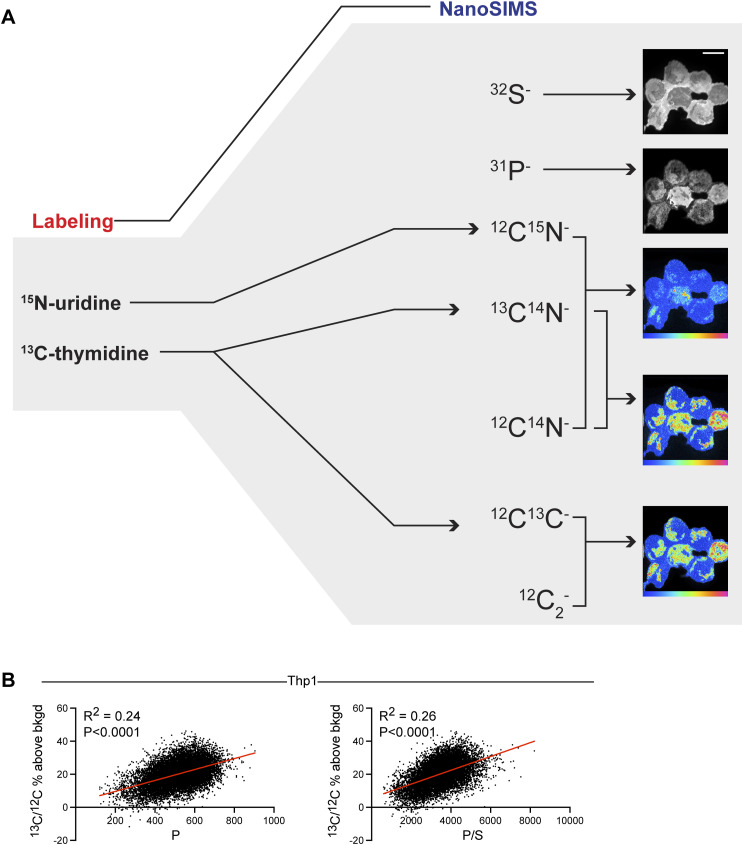
Figure S1. Multi-isotope imaging mass spectrometry imaging of DNA and RNA.
(A) Schematic of NanoSIMS analyses to capture intracellular features and multiplexed stable isotopic labeling of nucleic acids. Scale bar = 10 μm. (B) Representative THP-1 cell labeled with 13C-thymidine. The left graph shows the intranuclear pixel correlation between P counts and the 13C/12C ratio expressed as percent above the natural background. The right graph shows the intranuclear pixel correlation between the P/S ratio and the 13C/12C ratio expressed as percent above the natural background. Because of the low sulfur content/emission from chromatin, the P/S ratio provided a slightly better correlation.

