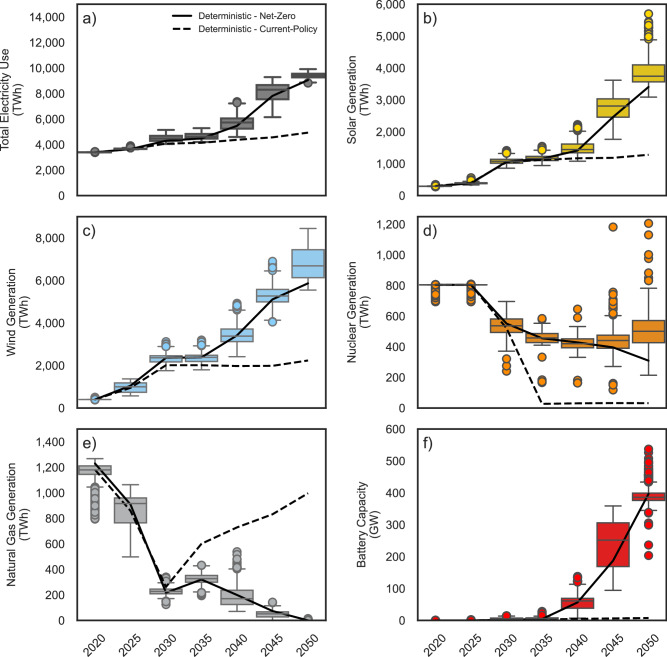
Fig. 2. Power sector characteristics in near cost-optimal net-zero CO2 pathways.
Near cost-optimal pathways in the power sector where box plots show (a) total electricity use across the entire energy system, (b) electricity generation from solar, (c) electricity generation from wind, (d) electricity generation from nuclear and (e) electricity generation from natural gas all in terawatt-hours (TWh). f shows the battery capacity in gigawatts (GW) deployed in the near cost-optimal decarbonization pathways. The solid lines show the deterministic least-cost net-zero pathway, while the dashed lines depict the least-cost current-policy. Box plots indicate median (middle line), 25th, 75th percentile (box) and 1.5 times the inter-quartile range from the first and third quartiles (whiskers) as well as outliers (single points). Source data are provided as a Source Data file.

