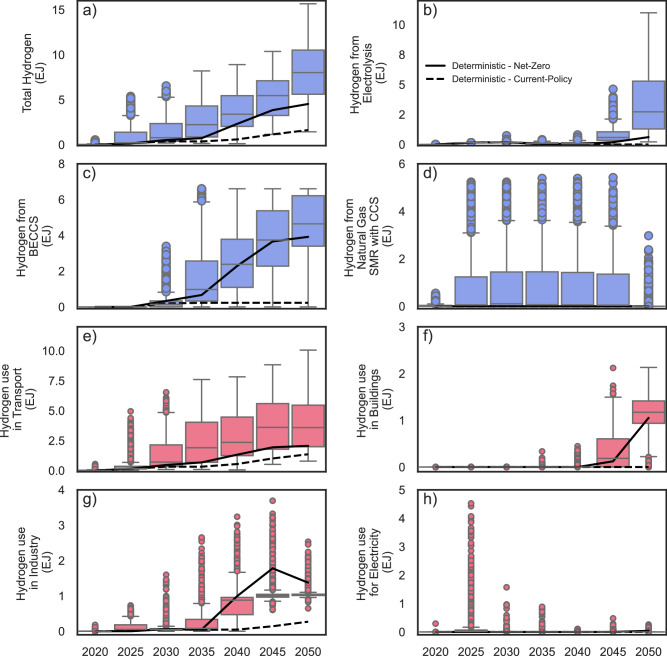
Fig. 3. Hydrogen production and consumption in near-cost optimal net-zero CO2 pathways.
The box plots in panels (a–d) show hydrogen production from 1100 near cost-optimal net-zero pathways: (a) total hydrogen production, b hydrogen from electrolysis, c hydrogen from bioenergy with carbon capture and storage (BECCS), and (d) hydrogen from natural gas steam methane reforming with carbon capture and storage (SMR with CCS), all in exajoules (EJ). The box plots in panels (e–h) show where hydrogen is used across the energy system in the near cost-optimal net-zero pathways: (e) transportation, (f) buildings, (g) industrial, and (h) electric sectors. The solid lines show the deterministic least-cost net-zero pathways, while the dashed lines in each panel represent the deterministic current-policy pathways. Box plots indicate median (middle line), 25th, 75th percentile (box) and 1.5 times the inter-quartile range from the first and third quartiles (whiskers) as well as outliers (single points). Source data are provided as a Source Data file.

