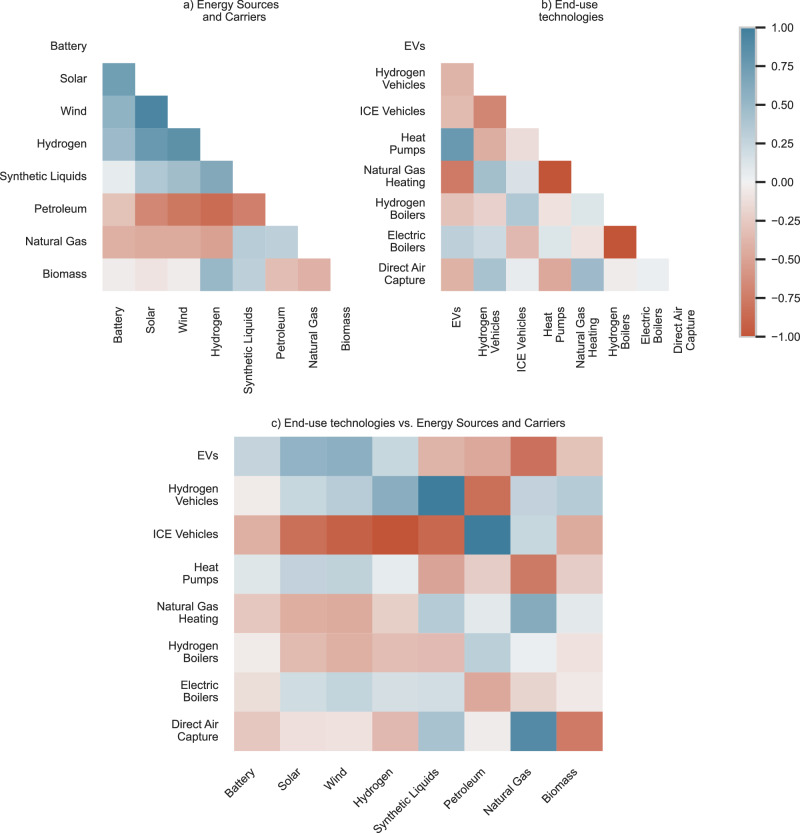
Fig. 6. Correlations across key energy carriers and technologies across near cost-optimal net-zero CO2 pathways.
A correlation plot showing a subset of key (a) energy sources and carriers, (b) end-use technologies along with DAC, and (c) end-use technologies versus energy sources and carriers across the 1100 near cost-optimal pathways in 2050. Blue represents positive correlations; red represents negative correlations. Battery–battery capacity, Solar–solar generation, Wind–wind generation, Hydrogen–total hydrogen use, Synthetic Liquids–production via the Fischer-Tropsch process, Petroleum–primary energy petroleum use, Natural gas–primary energy natural gas use, Biomass–primary energy biomass use, EVs–electric vehicle use, H2 vehicles–hydrogen used in transportation, ICE vehicles–internal combustion vehicle use, Heat pumps–heat pump use across the residential and commercial sectors, Natural gas heating–natural gas-based heating use in the residential and commercial sectors, Hydrogen boilers– hydrogen boiler use in the industrial sector, Electric boilers–electric boiler use in the industrial sector, DAC–direct air capture deployment. Source data are provided as a Source Data file.

