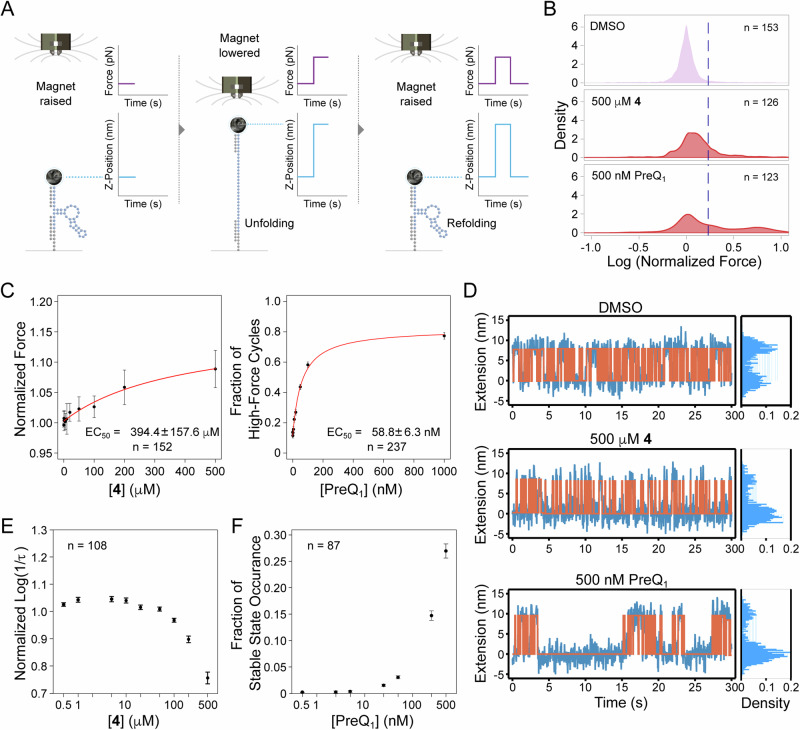
Fig. 5. Magnetic force spectroscopy (MFS) analysis of ligand binding.
A Overview of Depixus’ single-molecule MSF platform for exploring the interactions of bioactive small molecule ligands with their target RNA structures in real-time. B Unfolding force distributions of the Bsu PreQ1 riboswitch aptamer in control, 4 and PreQ1 ligand conditions. C Dose-response curve for the change in unfolding of the aptamer in the presence of 4 and PreQ1. D Raw traces of the constant-force experiments for control, 4, and PreQ1 of a single molecule with cumulative density histograms are shown to the right. E The aptamer unfolding rate as a function of the concentration of 4 in constant force experiments. F The impact of PreQ1 ligand concentration on the occurrence probability of the stable folded state. n is the number of molecules analyzed, and the values represent mean ± standard deviation (SD).

