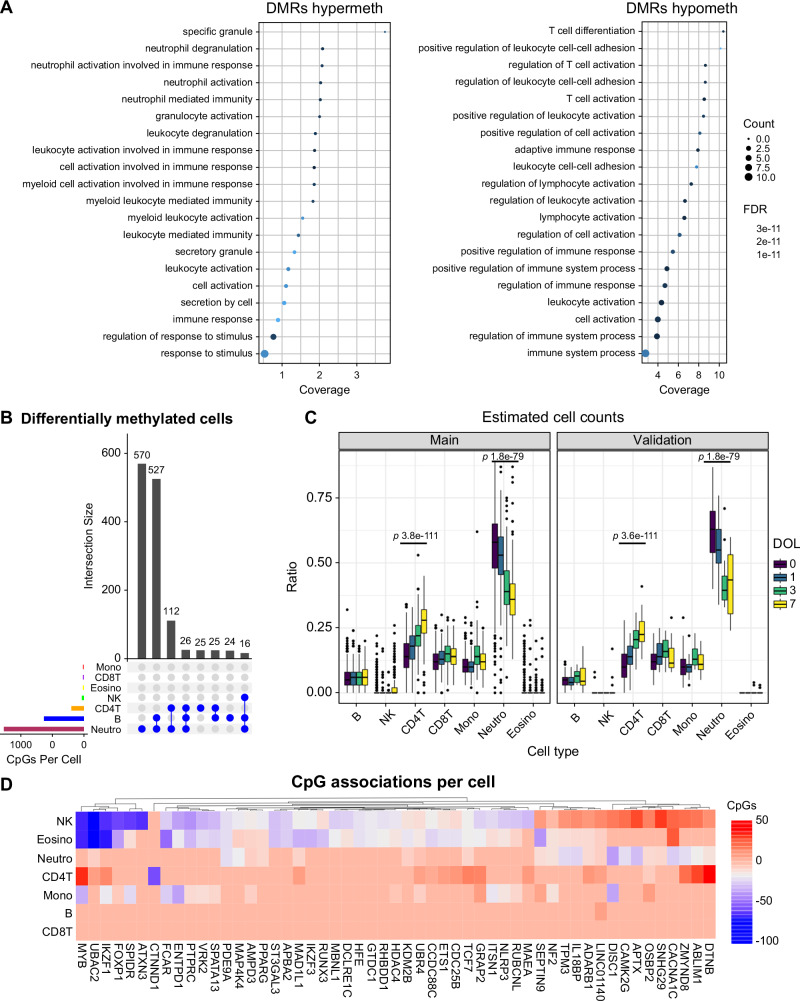
Fig. 2. Differentially methylated cell type analysis reveals enrichment in neutrophils and lymphocyte populations.
A Dotchart of gene ontology enrichment analysis of the DOL ontogeny signature highlighting significantly enriched pathways. B Upset plot showing counts of shared and unique differentially methylated CpGs among blood cell populations from DMCT analysis. C Deconvoluted whole blood cellular ratios inferred from DNA methylation profiles. Boxplots show the median and interquartile range (IQR, 25th-75th percentile). Whiskers extend to the most extreme data points within 1.5 times the IQR from the box hinges (the 25th and 75th percentiles). Points outside this range are considered outliers and are plotted individually). P-values are one-way repeated measures ANOVA. D Heatmap visualization of the number of CpG associations per cell for the top 50 ranked genes. Positive associations are shown in red, and negative associations in blue. *** = P < 0.001, repeated measures ANOVA. Total n = 1267 samples.

