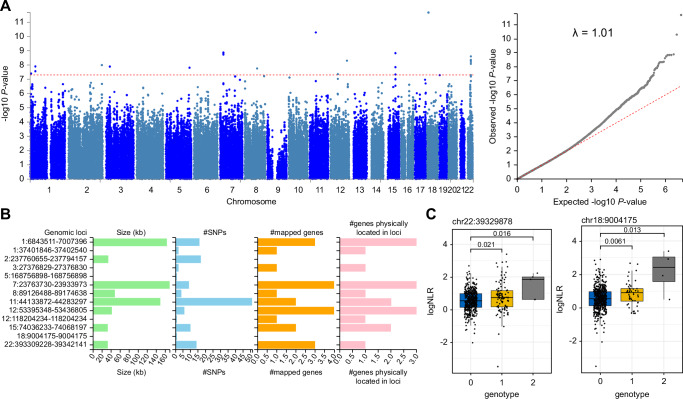
Fig. 5. Genome-wide association analysis of baseline NLR trait in African newborns from the main cohort.
A GWAS summary statistics for linear regression under the additive genetic model with genome-wide significance threshold is shown in red (left panel). The quantile-quantile plot of P-values with genomic inflation score (right panel). B Thirteen genomic-risk loci were identified from GWAS summary statistics using the FUMA GWAS tool. Genomic location is shown on the y-axis with region size, number of SNPs and mapped genes shown for each region. C Median difference in log NLR shown as a function of genotype for two top-ranked SNPs on Chromosome 22 (left panel) and Chromosome 18 (right panel). Exact P-values are shown using the Wilcox test. Boxplots show the median and interquartile range (IQR, 25th-75th percentile). Whiskers extend to the most extreme data points within 1.5 times the IQR from the box hinges (the 25th and 75th percentiles). Points outside this range are considered outliers and are plotted individually). Genotype codes indicate the presence of a minor allele of the SNP variant; 0 = homozygous major allele, 1 = hemizygous, 2 = homozygous minor allele. Total n = 557.

