FIGURE 4.

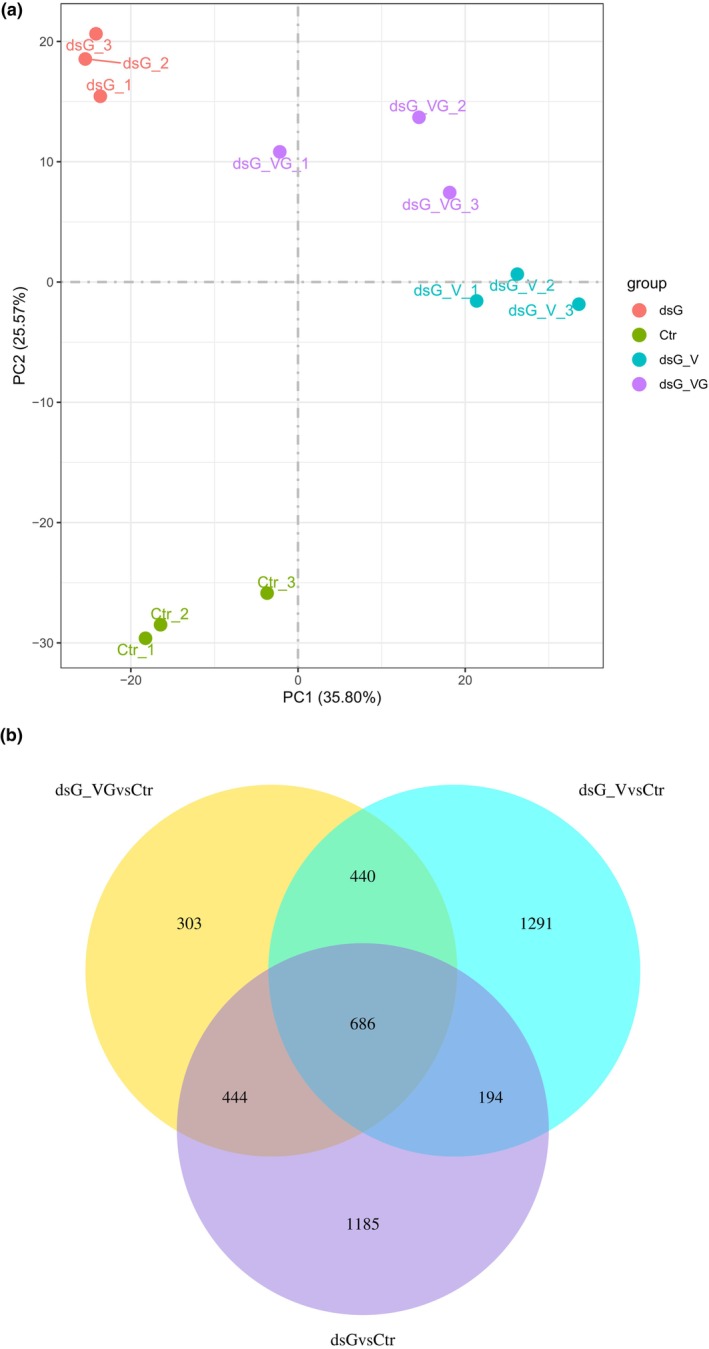
Transcriptional reprogramming associated with either dsRNA alone or virus infections targeted or not by dsRNA. (a) Principal component analysis (PCA) of RNA‐seq data. The PCA was performed using normalized RNA‐seq data of differentially expressed genes (DEGs) between treatments at 4 days post‐inoculation. Each biological replicate is represented in the score plot. The variance explained by each component (%) is given in parentheses. Treatments were as follows: dsGFP alone (dsG), PVX‐GFP combined with dsGFP (dsG_VG), wild‐type PVX combined with dsGFP (dsG_V) and bacterial nucleic acid extracts not expressing dsRNA as a control (Ctr). PCA was performed using the R package. (b) Venn diagrams displaying the number of DEGs with a log2(fold‐change) ≥|1| and adjusted p‐value ≤0.05 in the dsG vs. Ctr, dsG_VG vs. Ctr and dsG_V vs. Ctr pairwise comparisons.
