
Fig. 6.
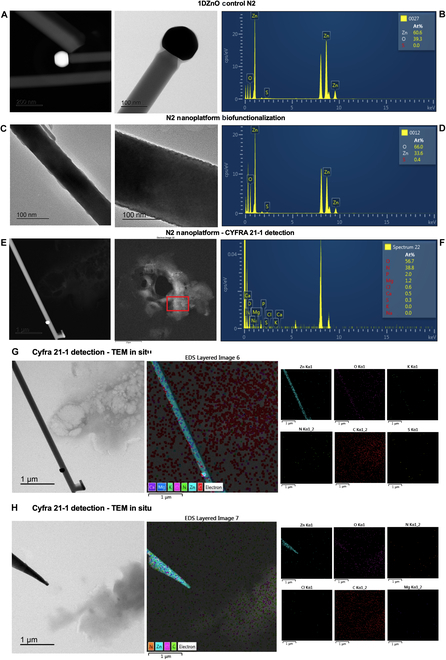
Microscopic visualization of 1DZnO N2 nanoplatforms’ nanostructural conformation after biofunctionalization and CYFRA 21-1 detection in artificial saliva. (A) TEM images of bare N2, (B) EDS analysis of bare N2, (C) TEM images of biofunctionalization, (D) EDS analysis of biofunctionalization, (E) TEM images of CYFRA 21-1 detection, (F) EDS analysis of CYFRA 21-1 detection, and (G and H) compositional mapping by EDS in STEM mode.