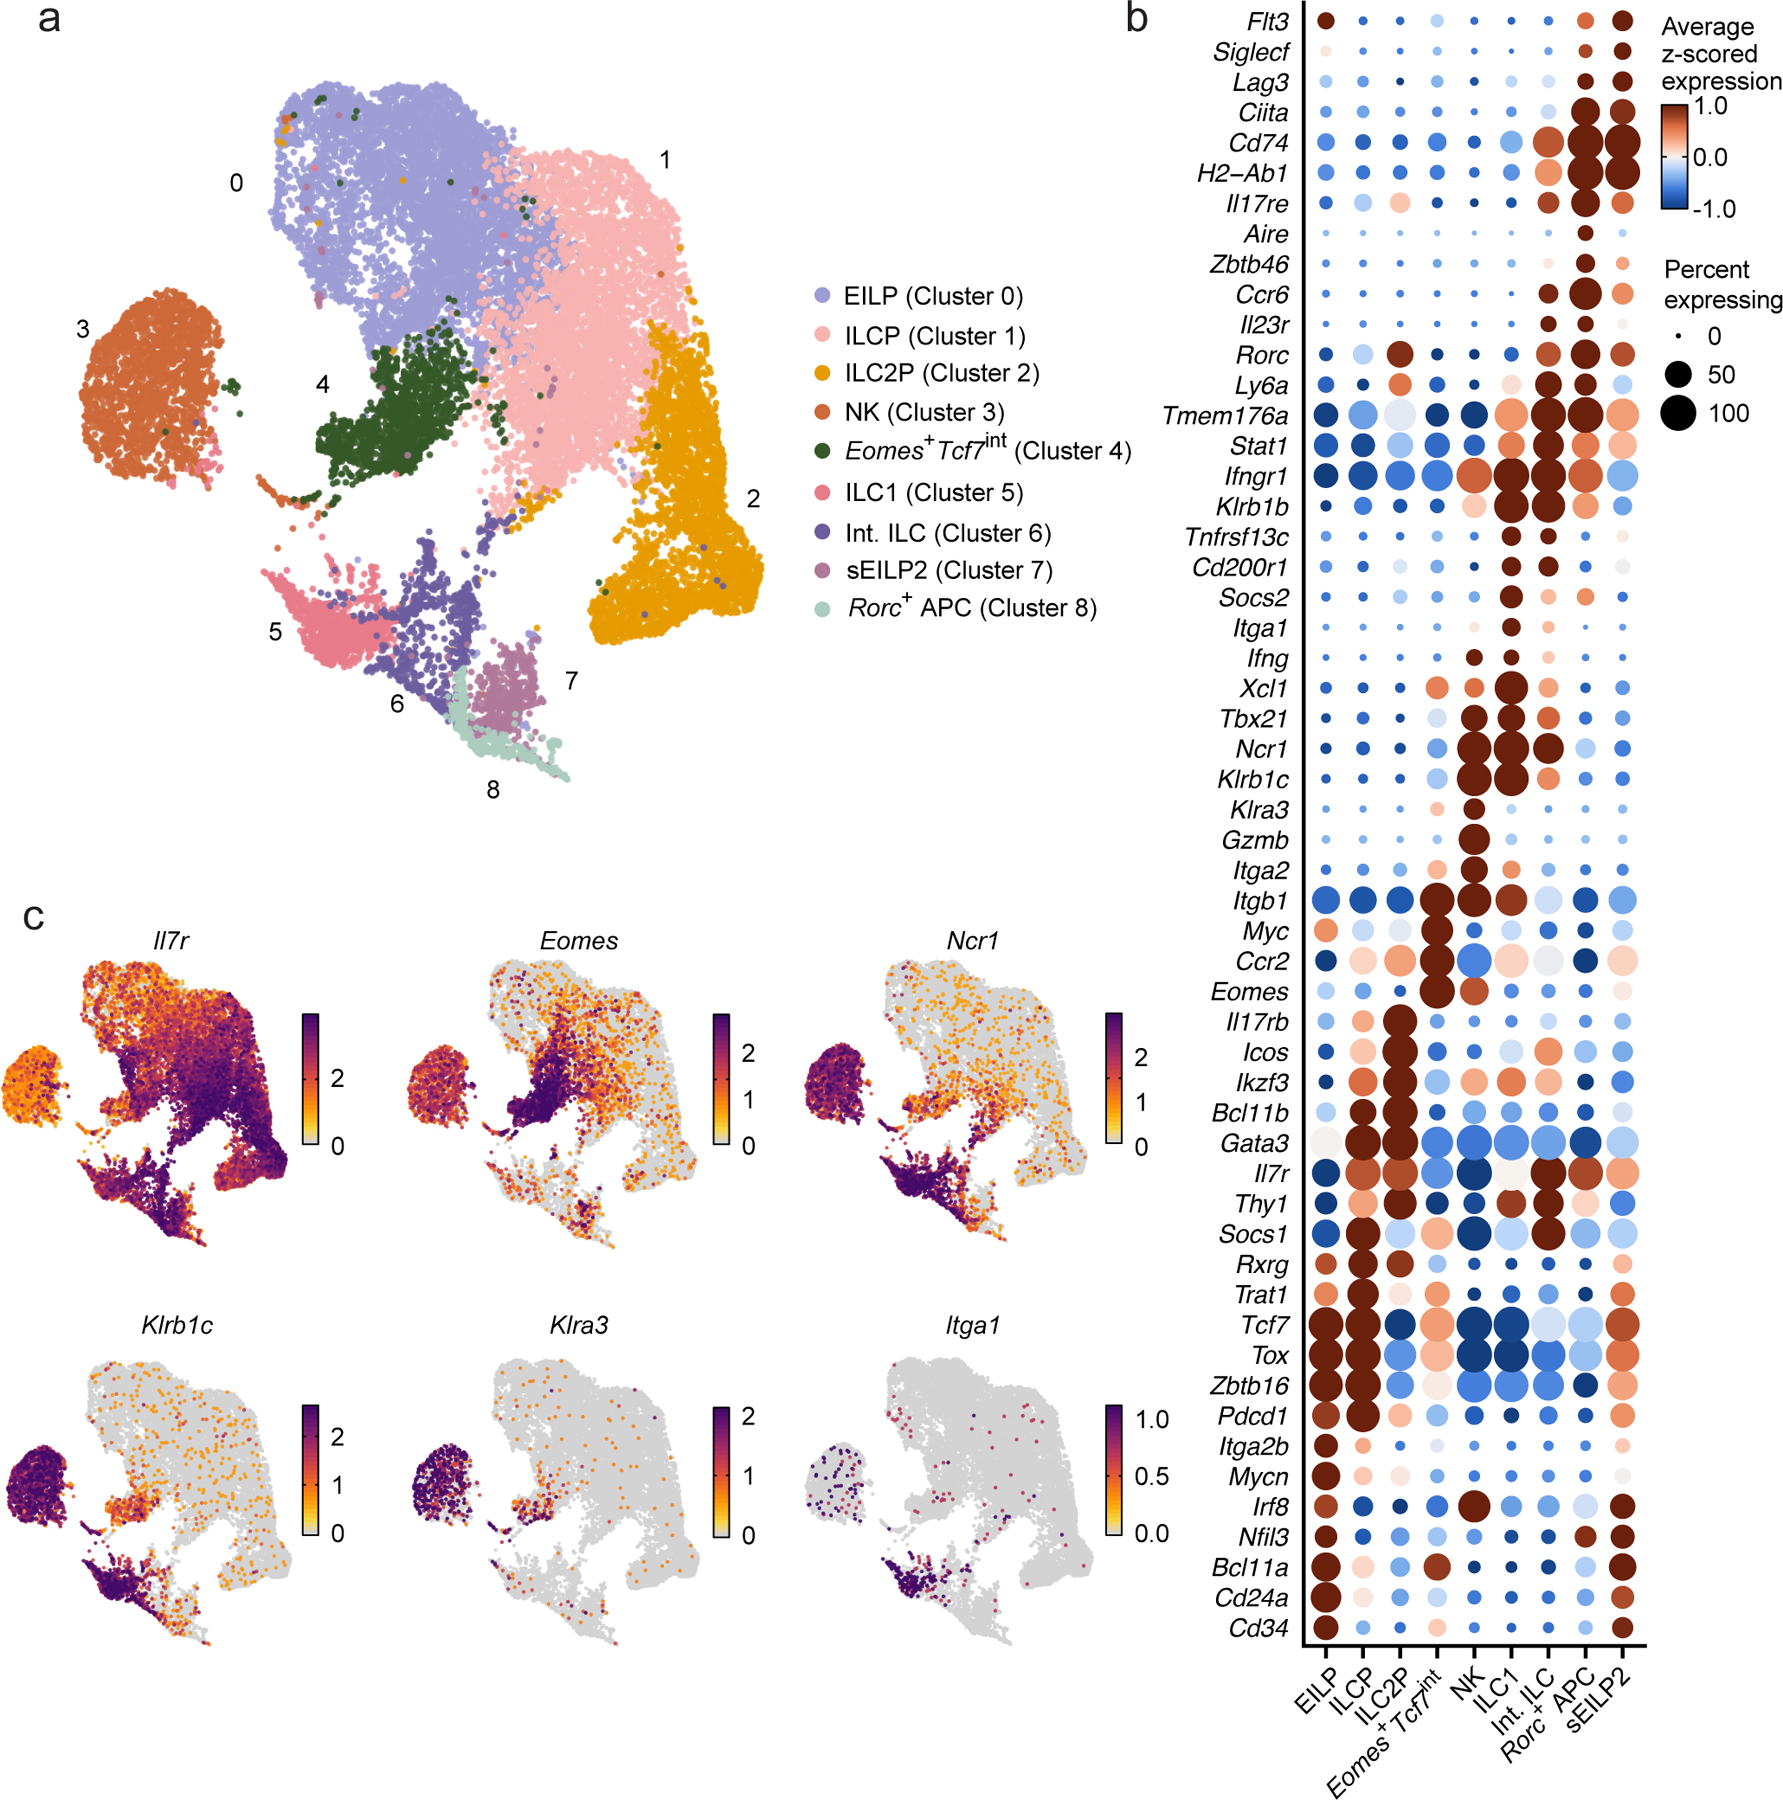
Figure 1. Identification of Eomes+ cells in the mouse BM.

a, UMAP embedding of scRNA-seq data showing 19,961 CD4−CD8−CD3ε−TCRβ−TCRγδ−CD19−B220−Gr1−CD11c−CD25−Ter119−(Lin−) Tcf7-mCherry+ cells and NK1.1+ cells sorted from the BM of 19 females and 16 males EomesGFP/+Tcf7mCherry/+Zbtb16hCD4/+RorcThy1.1/+ mice, annotated by cluster (color, index number). b, Dot plot showing the expression of curated genes that are differentially expressed in a cluster relative to all other cells in clusters as in a. FDR-adjusted P < 0.05; absolute value of the log2-fold change (abs. log2FC) > 0.5. Dot color: row z-scored, cluster average of log- and size-normalized gene counts (normalized expression). Dot size, percent of cells in cluster with positive expression of the gene. c, UMAP embeddings, colored by normalized expression of curated differentially expressed genes as in b.
