
Extended Data Fig. 5. NK cells emerge post-natally.
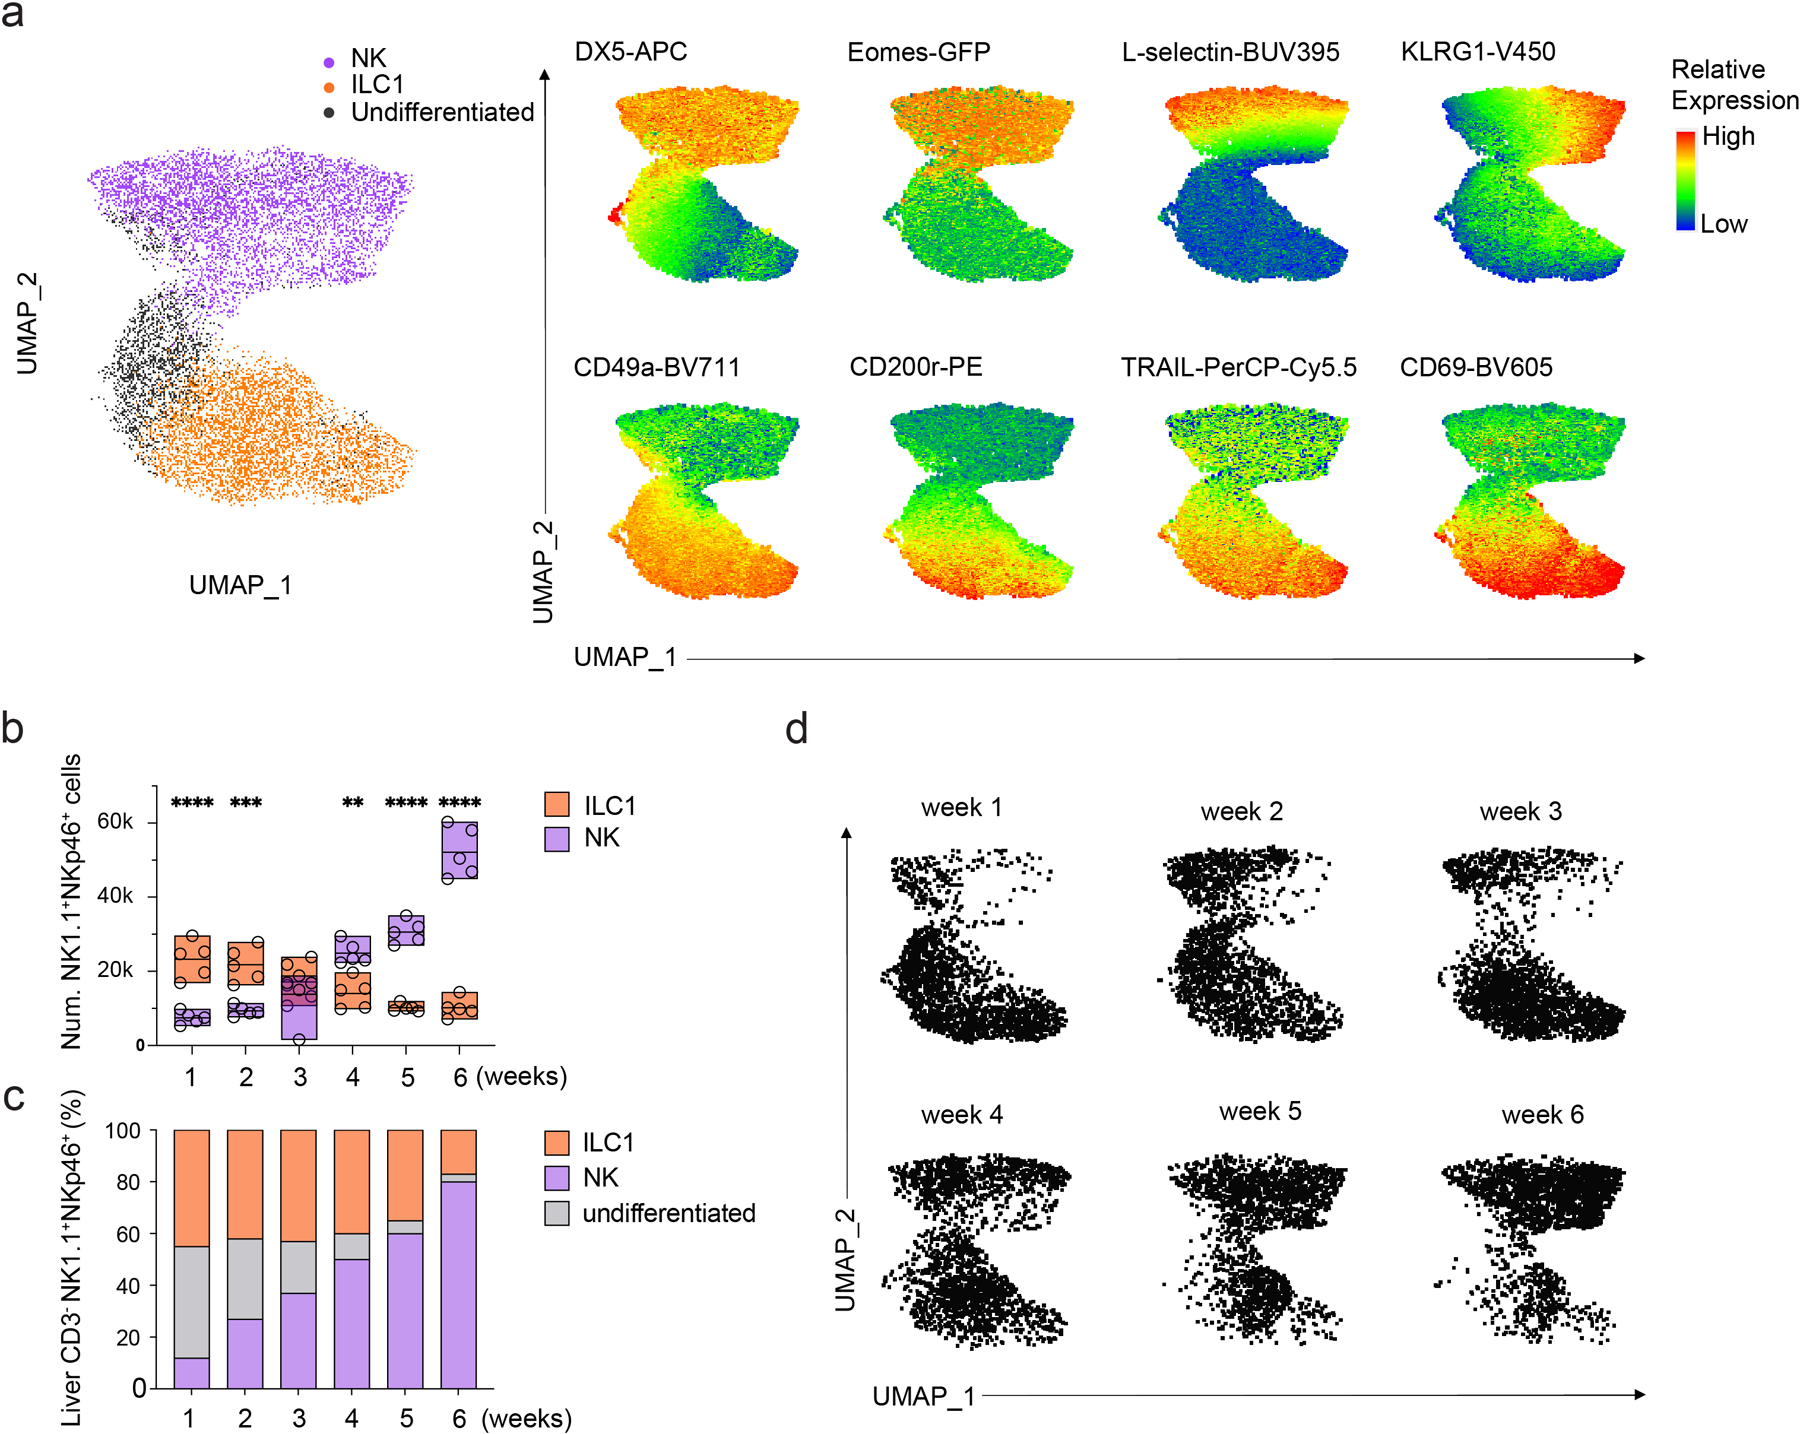
, UMAP clustering of high dimensional flow cytometry data and corresponding heatmap displaying relative expression DX5, L-selection, Eomes, KLRG1, CD49a, TRAIL, CD69 and CD200r among CD45+CD3ε−NK1.1+NKp46+ liver lymphocytes from 1–6 week-old mice. b, bar graph showing the number of DX5+CD49a− NK cells (n=5) or DX5−CD49a+ ILC1s (n=5) among CD45+CD3ε−NK1.1+NKp46+ liver lymphocytes of 1–6 week-old mice. Data are representative of three independent experiments. Data represent mean ± s.e.m. **P<0.01, ***P<0.001, ****P < 0.0001. c, bar graph showing the frequency of DX5+CD49a− NK cells (n=4), DX5−CD49a+ ILC1s (n=4) and DX5loCD49a+ undifferentiated cells (n=4) among CD45+CD3ε−NK1.1+NKp46+ liver lymphocytes from 1–6 week-old mice. Data are representative of two independent experiments. Data represent mean. d, UMAP clustering of high dimensional flow cytometry data showing the composition of DX5+CD49a− NK cells and DX5−CD49a+ ILC1s among CD45+CD3ε−NK1.1+NKp46+ liver lymphocytes from 1–6 week-old mice.