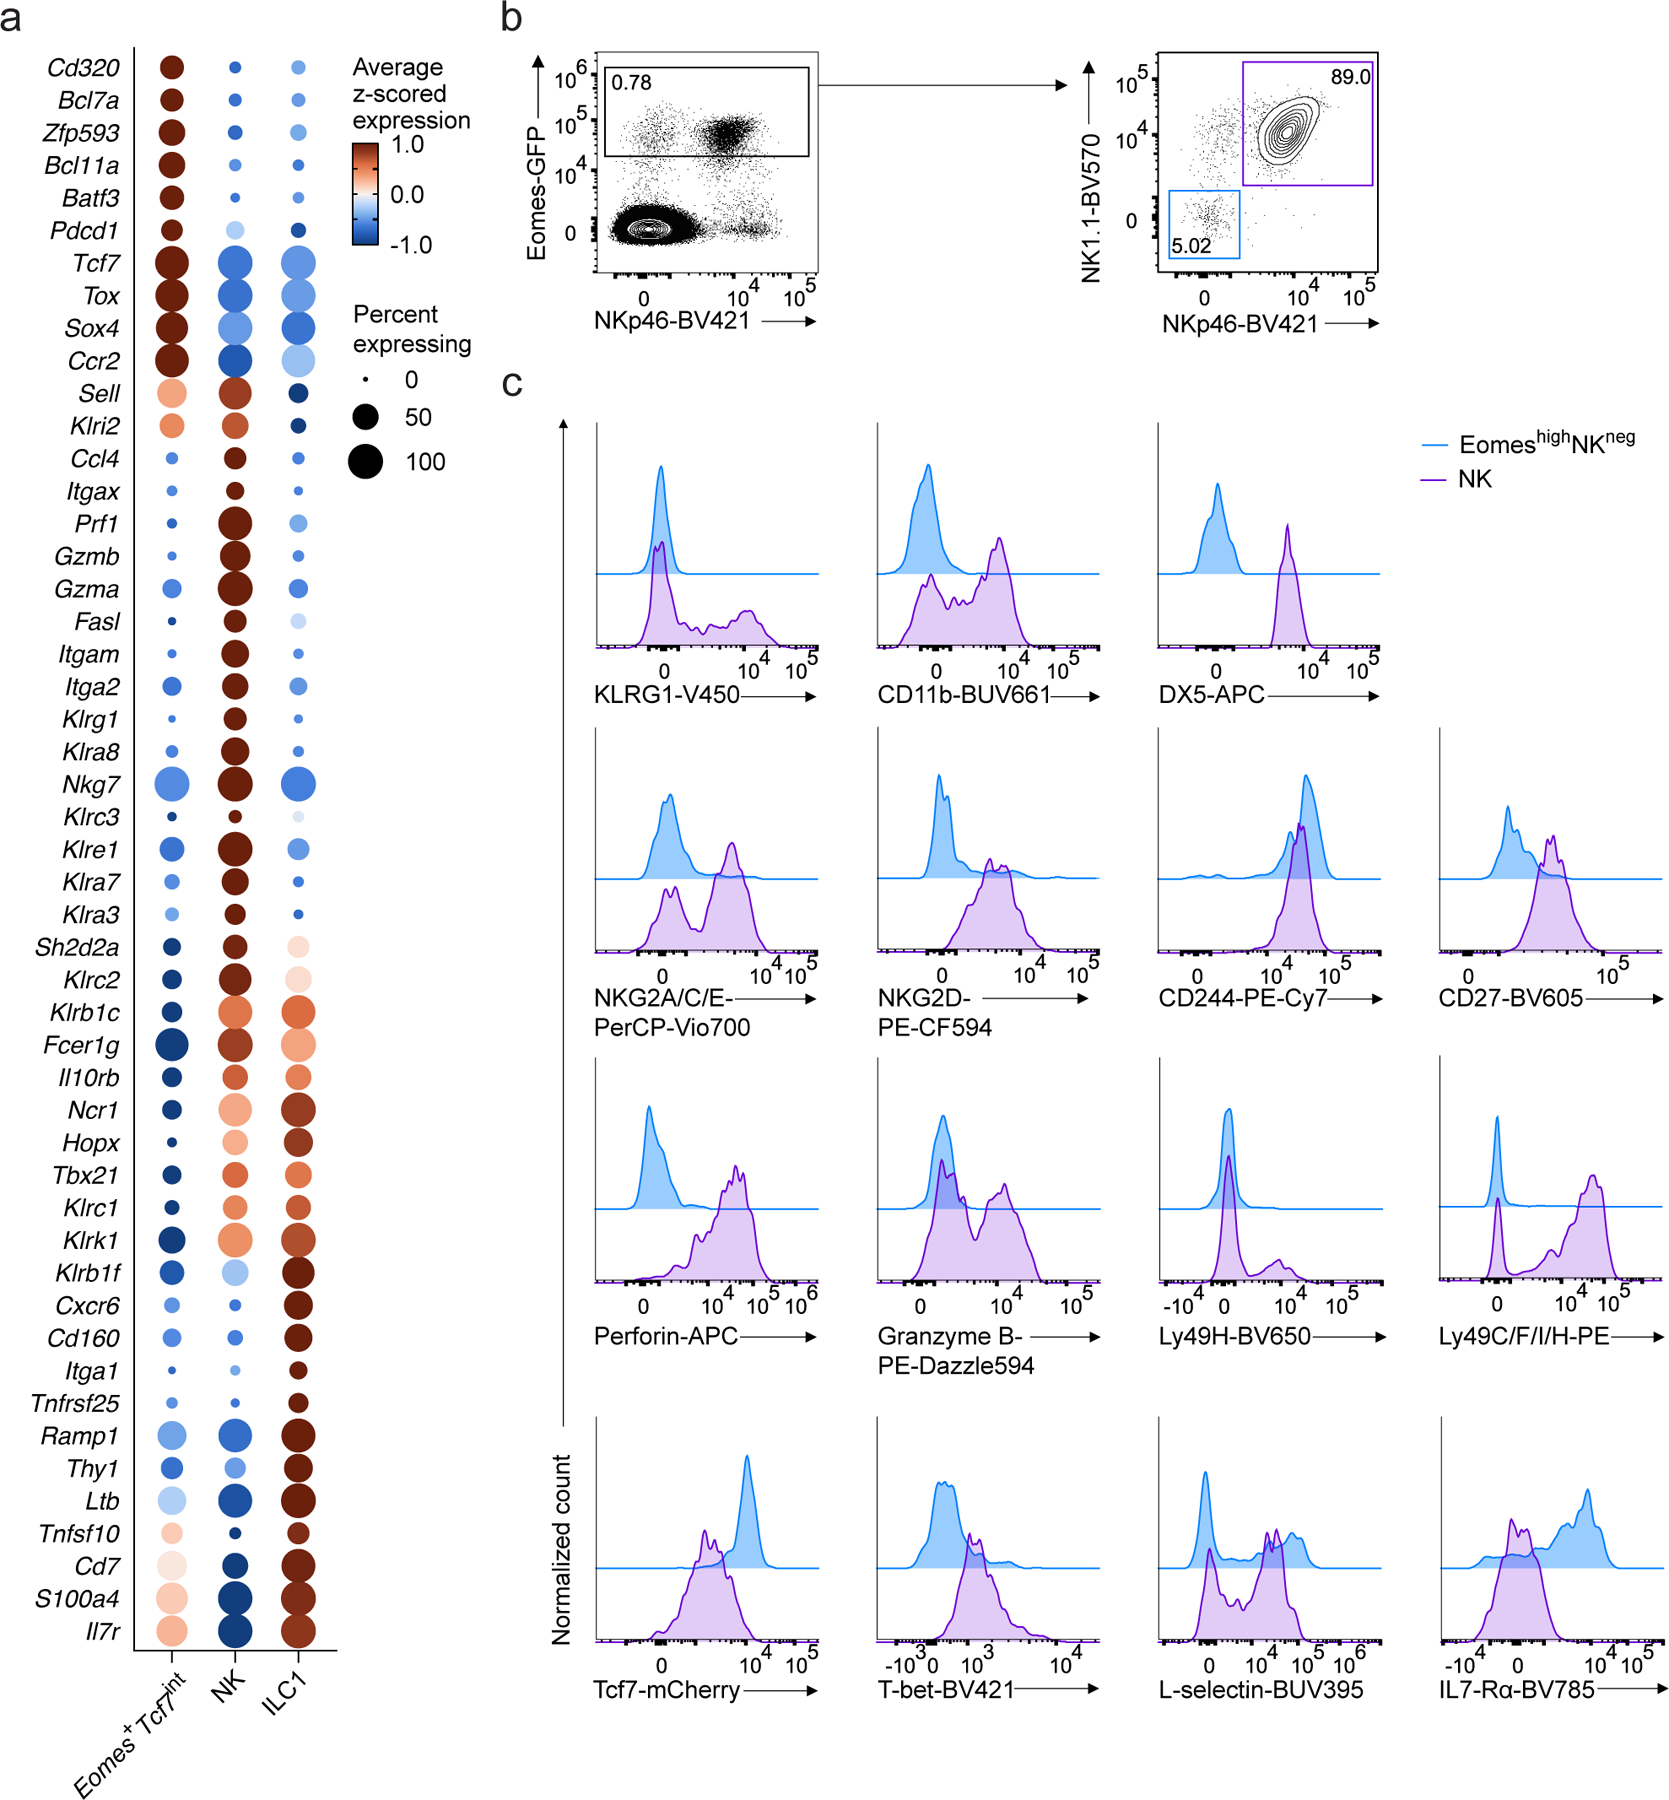
Figure 2. EomeshiNKneg cells are distinct from NK cells and ILC1s.

a, Dot plot showing expression of select genes differentially expressed in Eomes+Tcf7int, NK, or ILC1 clusters, relative to the other two clusters in scRNA-seq data. FDR-adjusted P < 0.05; abs. log2FC > 0.5. Dot color, size, as in Fig. 1b. b, Representative flow cytometry plots of Eomes-GFP+NK1.1−NKp46− cells (EomeshiNKneg) and Eomes-GFP+NK1.1+NKp46+ NK cells in BM CD4−CD8−CD3ε−TCRβ−TCRγδ−CD19−B220−Gr1−CD11c−CD25−Ter119−(Lin−) CD45+ cells from EomesGFP mice. c, Representative histogram showing the expression of NK associated markers KLRG1, CD11b, DX5, NKG2A/C/E, NKG2D, CD244, CD27, perforin, granzyme B, Ly49H, Ly49C/F/I/H, TCF7, T-bet, L-selectin and IL-7Rα on EomeshiNKneg cells or NK cells from the BM of EomesGFP/+Tcf7mCherry/+ mice. Data are pooled from 2 independent experiments.
