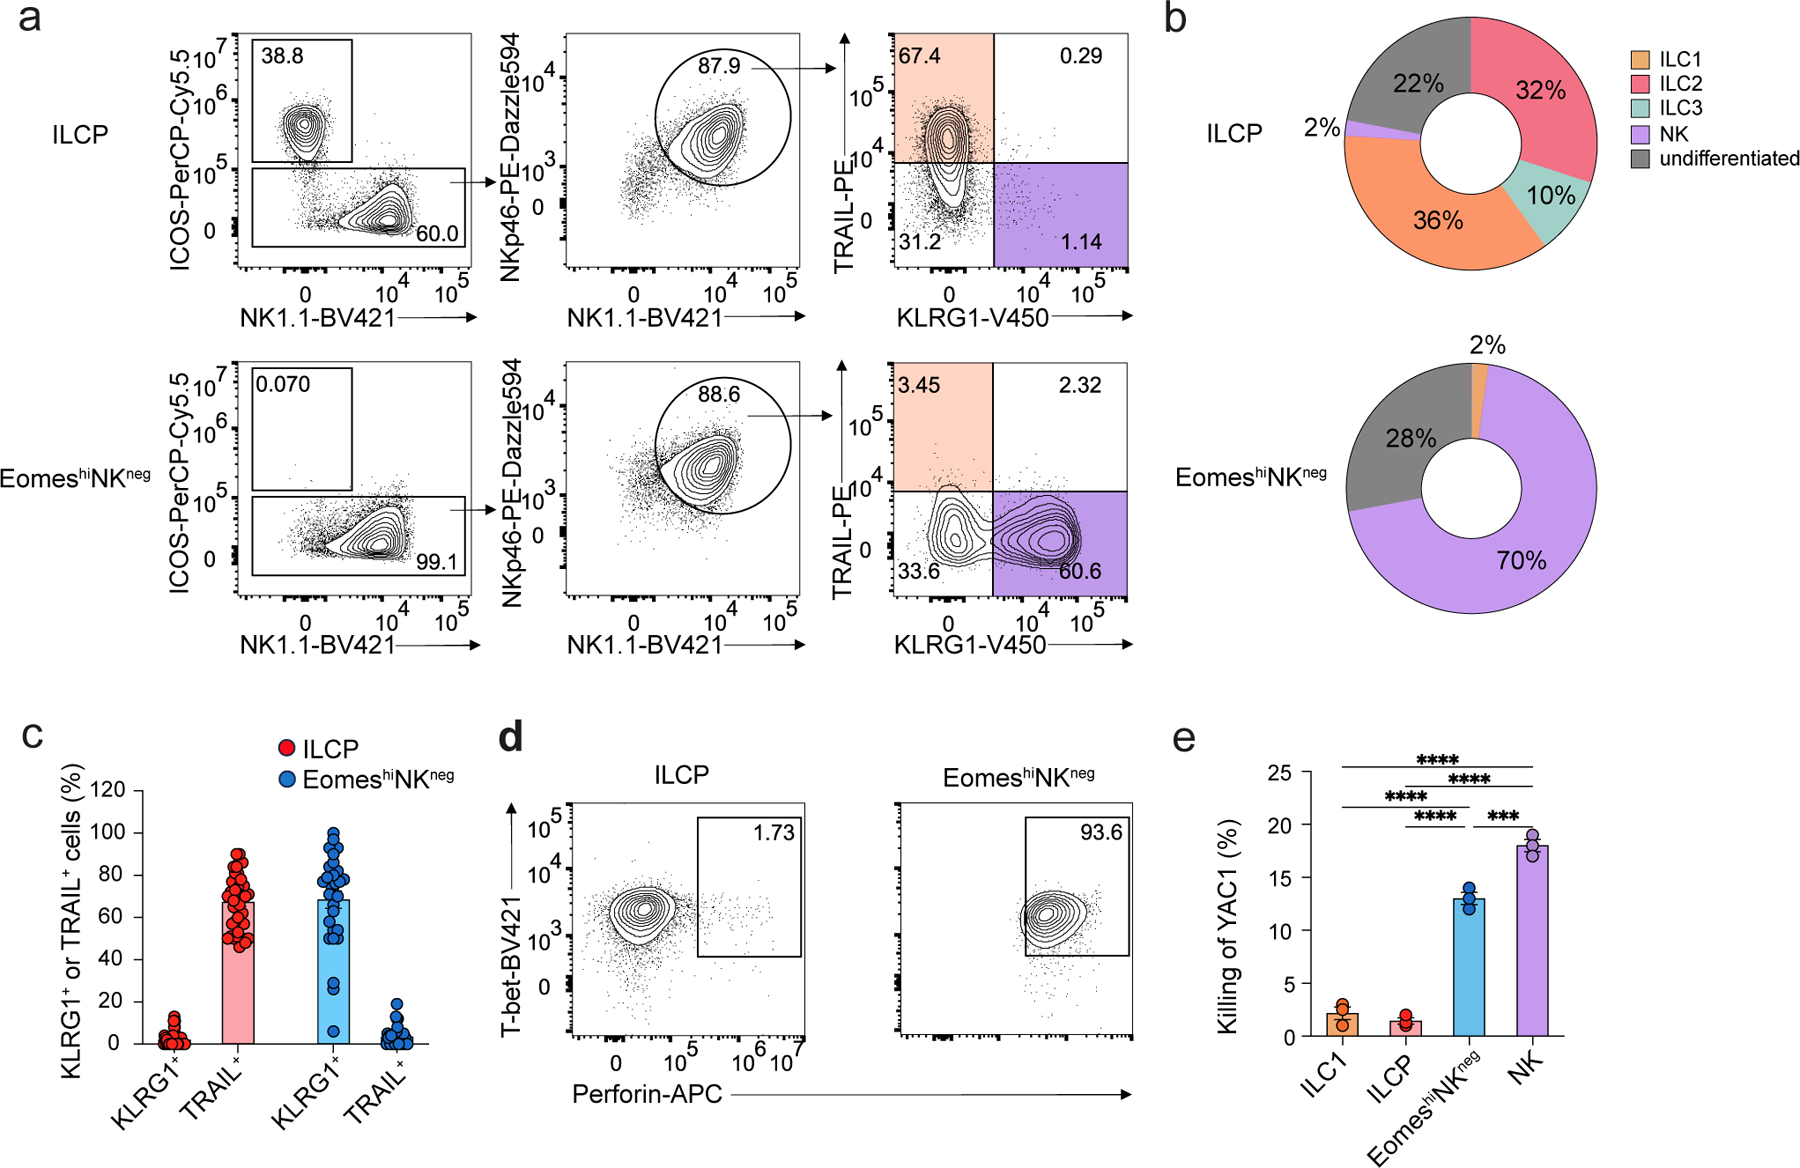
Figure 5. EomeshiNKneg cells generate functional NK cells in vitro.

a, Representative flow cytometry plots showing ILCP- and EomeshiNKneg cell-derived NK1.1–ICOS+ ILC2/ILC3s, NK1.1+ICOS–TRAIL+KLRG1– ILC1s and NK1.1+ICOS–TRAIL–KLRG1+ NK cells on day 7 of co-culture with OP9 cells with IL-2, IL-7 and SCF. b, Pie chart showing the average frequency of NK1.1–ICOS+Rorc-Thy1.1– ILC2s, NK1.1–Rorc-Thy1.1+ ILC3s, NK1.1+ICOS–TRAIL+KLRG1– ILC1s, NK1.1+ICOS–TRAIL–KLRG1+ NK cells and NK1.1+ICOS–TRAIL–KLRG1– undifferentiated cells in ILCP or EomeshiNKneg cell-derived progenies at day 7 as in a. Data are representative of three independent experiments. c, Bar graph showing the expression of TRAIL and KLRG1 on NK1.1+ICOS– cells derived from single ILCP (n=37) or EomeshiNKneg cells (n=19) at day 7 as in a. d, Intracellular staining of Tbet and perforin in ILCP- or EomeshiNKneg cell-derived NK1.1+ICOS–Nkp46+ cells at day 7 of culture as in a. e, Percentage of efficiency of killing of YAC1 tumor cells cultured at 1:1 ratio with NK1.1+ICOS– cells derived from Eomes-GFP−NK1.1+IL-7Rα+ ILC1s (n=3), α4β7+CD244+IL-7Rα+CD90+PD1+ ILCPs (n=3), EomeshiNKneg cells (n=3) or Eomes-GFP+NK1.1+ NK cells (n=3) sorted from the BM of EomesGFP mice, co-cultured with OP9 cells with IL-2, IL-7, SCF for 6 days and stimulated with IL-15 overnight. Statistical significance was calculated by two-way ANOVA with Tukey’s multiple comparisons test. Data represent mean ± s.e.m. ***P<0.001, ****P < 0.0001
