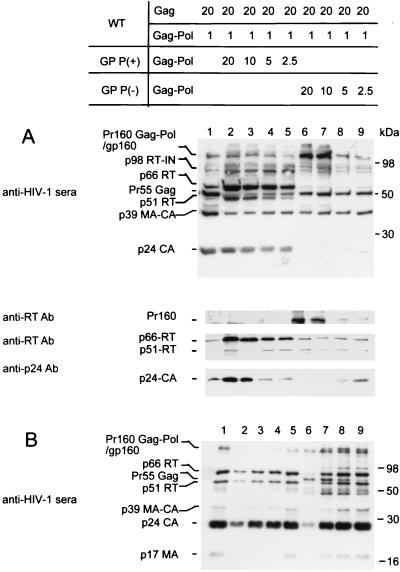
FIG. 2.
Impact of altered Gag/Gag-Pol ratios on HIV-1 protein profiles of infected cells and virions. Viral proteins were semiquantified by Western blot analysis. Cell lysates (A) and purified virions (see Materials and Methods) (B) were resolved by SDS–10% PAGE. Resolved proteins were probed using sera from HIV-1-infected individuals and monoclonal antibodies (Ab) to RT and p24 as described in Materials and Methods. Lane 1 (A and B) shows wild-type (WT) HIV-1 protein profiles in cell lysates and virions, respectively; lanes 2 to 5 (A and B) show cell lysate and virion protein profiles with estimated HIV-1 Gag/Gag-Pol ratios of 20:21, 20:11, 20:6, and 20:3.5, respectively. A GP PR(+) expression vector was used to produce excessive levels of Gag-Pol in lanes 2 to 5 (see Materials and Methods). Similarly, lanes 6 to 9 show cell lysate and virion protein profiles with estimated HIV-1 Gag/Gag-Pol ratios of 20:21, 20:11, 20:6, and 20:3.5, respectively. Expression vector GP PR(−) was used to produce an excess of Gag-Pol protein that is not processed by PR in lanes 6 to 9 (see Materials and Methods). MA, matrix.

