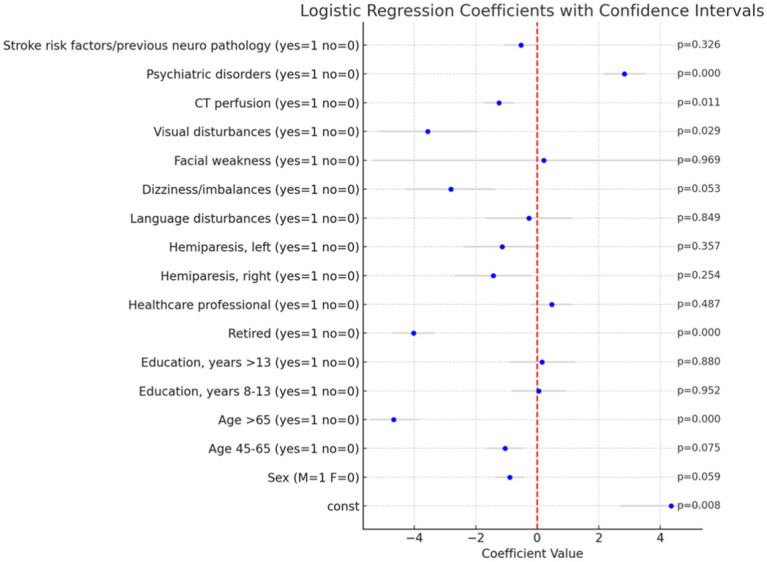
Figure 2.
Logistic regression coefficients with confidence intervals and p-value. The bar plot illustrates the coefficients of the logistic regression analysis performed to predict the likelihood of a Mimic diagnosis versus an Ischemic diagnosis. Each bar represents the coefficient of a variable, and the gray lines indicate the 95% confidence intervals for these coefficients. p-values are reported on the right.

