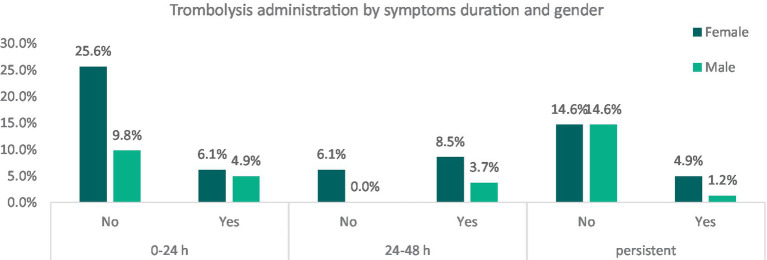
Figure 3.
Relative frequencies of thrombolysis administration among patients, divided by gender and symptoms’ duration. It categorizes patients into males and females and further divides them based on whether they received thrombolysis treatment (“Yes” or “No”). These categories are then cross-referenced with the duration of symptoms. The graph illustrates the relative frequencies of thrombolysis administration among stroke mimic patients, segmented by gender and symptom duration. While this data highlights early intervention trends, it does not provide direct evidence of a placebo effect influencing symptom duration.

