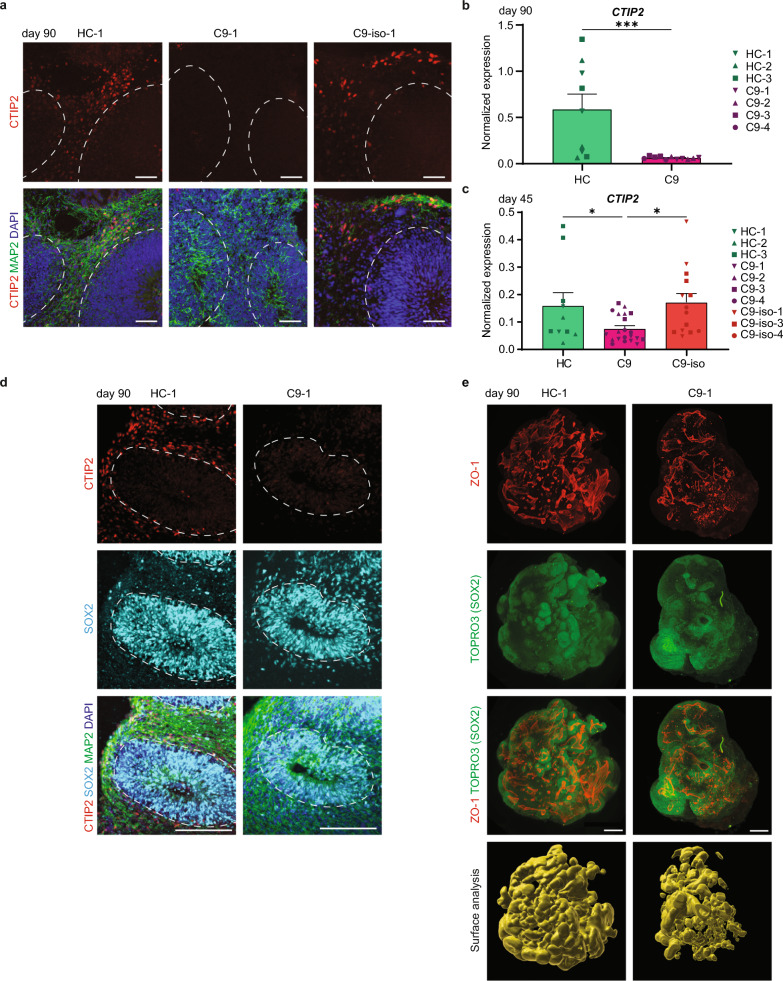
Fig. 4.
C9-HRE causes a reduction of deep layer neurons and disorganized radial glia. a Immunohistochemistry for CTIP2, to mark deep layer neurons (red), and MAP2, to label neuronal regions (green), in day 90 healthy control (HC), C9-ALS/FTD (C9) and corresponding isogenic control (C9-iso) organoids. Dotted line indicates the border of ventricular-like zones (VLZ). DAPI in blue. b, c Quantitative PCR for the deep layer neuron marker CTIP2 in day 90 HC and C9 organoids (b) and day 45 HC, C9, and C9-iso (c) organoids. Expression is normalized to TBP and RPII. Graphs show mean ± SEM, symbols indicate specific lines and dots represent an average measurement of 3 organoids pooled per independent organoid induction (b: n = 4 C9, and n = 3 HC, Mann–Whitney t-test, U = 7, p = 0.0005; c: n = 3 HC, n = 4 C9 and n = 3 C9-iso, One-way ANOVA, Holm–Sidak’s multiple comparisons test, F(2,42) = 4.389, p = 0.019). d Immunohistochemistry for CTIP2, to mark deep layer neurons (red), MAP2, to label neuronal regions (green), and SOX2, to mark neural stem cells in the VLZ (light blue) in day 90 HC, and C9organoids. Dotted line indicates the border of VLZs. DAPI in blue. e Whole-organoid immunostaining followed by 3DISCO tissue clearing and fluorescent lightsheet imaging. Representative 3D rendering of an HC and C9 organoid, in which the tight junction marker ZO-1 depicts the borders of the ventricular lumen in red and the nuclear marker TOPRO3 indicates the denser ventricular-like zones (VLZs) in green, which was confirmed by the stem cell marker SOX2 in another channel. The selection volume of the VLZs is shown in yellow. Scale bars: a 50 μm, d 150 μm, e 100 μm * = p < 0.05, *** = p < 0.001

