Fig. 6.
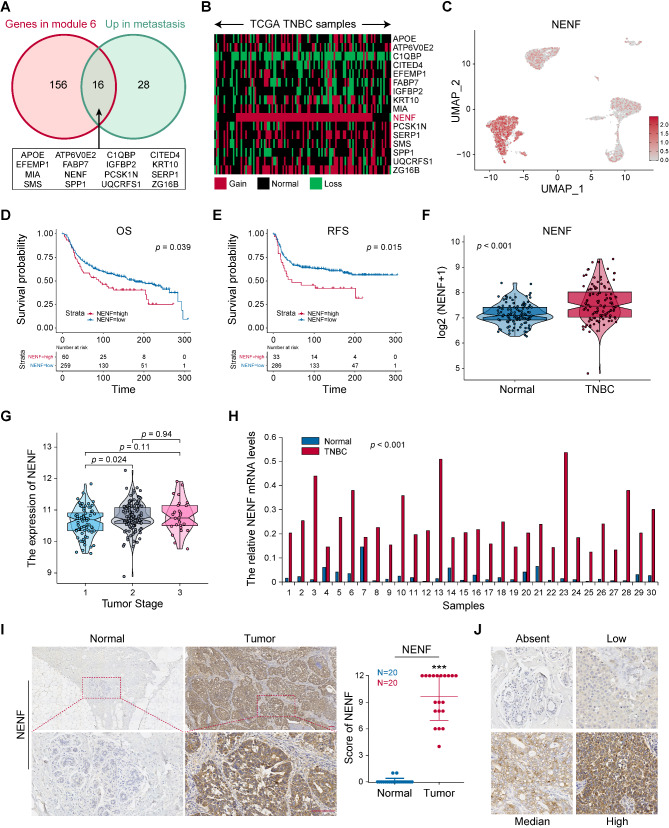
NENF was identified metastasis related gene and upregulated in TNBC. A The intersection of genes in module 6 and upregulated genes in metastatic TNBC cells showed by Venn diagram. B The copy number changes of candidate genes in TCGA-TNBC were displayed by heat map. C tSNE scatter plots displayed the expression of NENF in TNBC malignant cells. The survival analysis of TNBC patients with high‑ or low‑NENF expression levels, including OS (D) and RFS (E), depicted by KM curves. F The NENF expression level in normal tissues and TNBC tissues. G The NENF expression level among TNBC stages. H The mRNA expression level of NENF in 30 paired TNBC tissues detected by RT-qPCR. I The protein expression level of NENF in 20 paired TNBC were detected by IHC and the scores of IHC staining. J The standard score of IHC staining. **p < 0.01, ***p < 0.001

