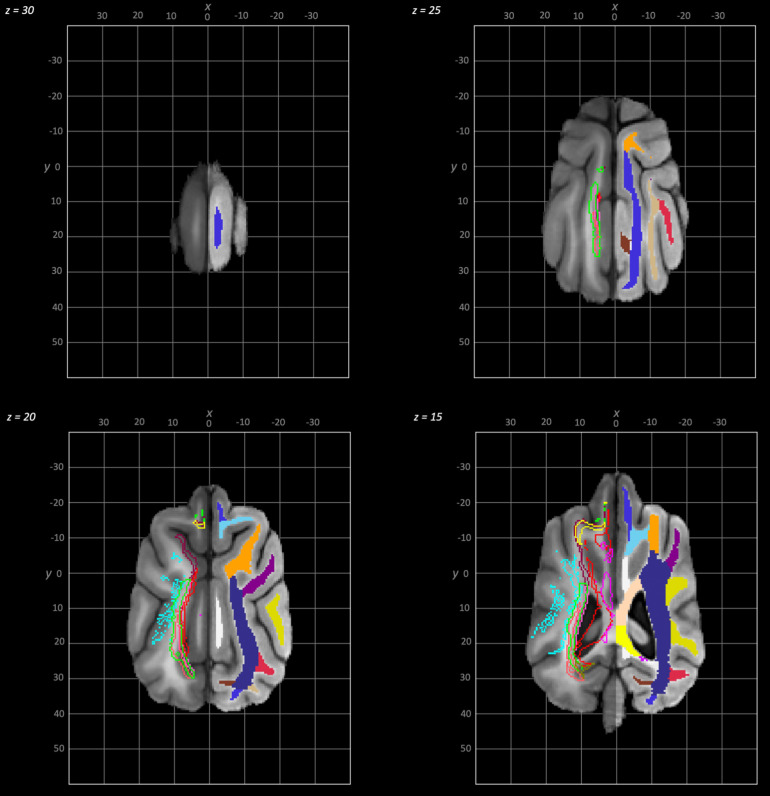
Fig. 3.
Dorsal to ventral dorsal plane slices of the population average brain template from z-30 to z-15. In each section, the left hemisphere demonstrates the white matter regions on the T1-weighted population average template and the right hemisphere demonstrates the white matter tracts dissected from the population average tractogram overlain on the population average FA map. The key for all regions is provided in Figure 8.

