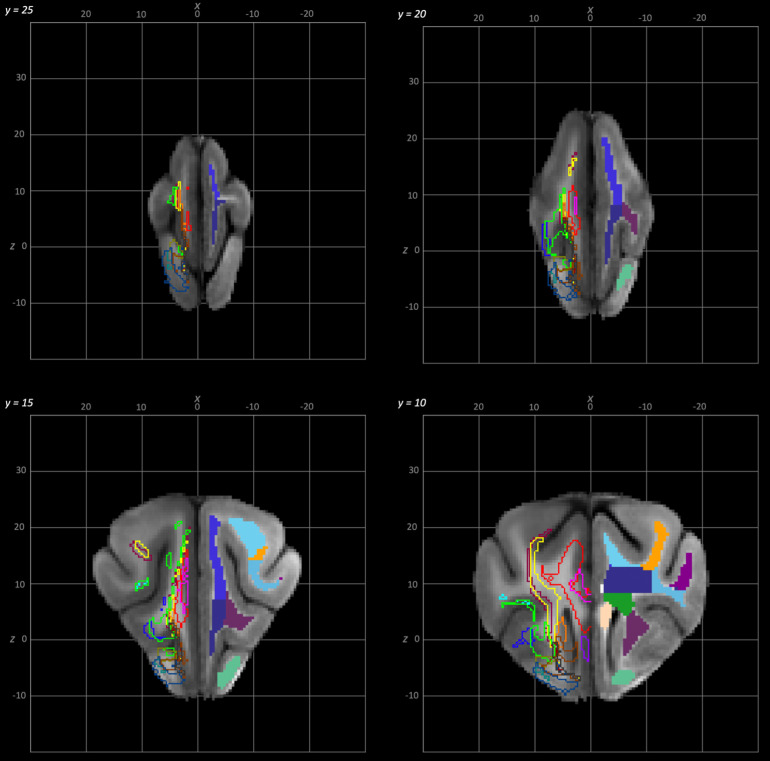
Fig. 5.
Rostral to caudal transverse slices of the population average brain template from y-25 to y-10. In each section, the left hemisphere demonstrates the white matter regions on the T1-weighted population average template and the right hemisphere demonstrates the white matter tracts dissected from the population average tractogram. The atlas key is provided in Figure 8.

