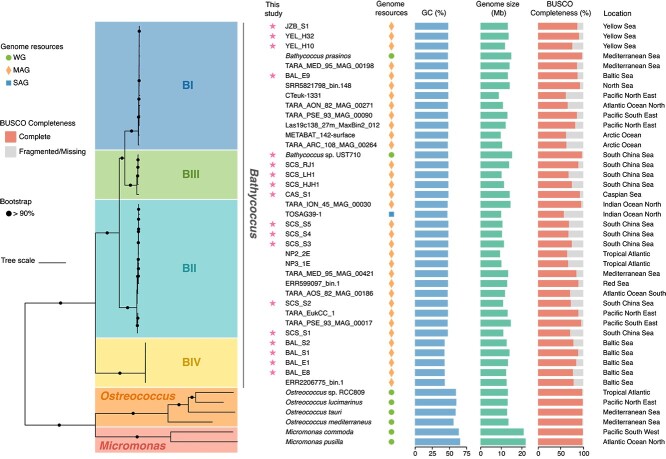
Figure 2.
Phylogeny and genome comparison of four Bathycoccus clades, BI, BII, BIII, and BIV. From left to right: (i) Phylogenomic tree depicting the relationships among 37 qualified genomes of Bathycoccus and other Mamiellophyceae members (Micromonas and Ostreococcus). The tree scale is 0.2. The tree was constructed using the concatenated sequence alignment of single-copy orthologs using the Q.pfam+F + I + R5 model. Taxonomy of the genomes is indicated. Bootstrap support values above 90% are denoted by black dots at the nodes. The scale bar represents branch length; (ii) names of the genomes with new genomes generated from this study marked by stars on the left. Different shapes on the right indicate the types of genome resources (WG for whole genome of the strain; MAG for metagenome-assembled genome; SAG for single-amplified genome); (iii) average GC content; (iv) genome size; (v) genome completeness based on BUSCO; (vi) geographic locations where the genome was recovered. Each qualified genome has a contamination level of <2% and a completeness level of over 50%.

