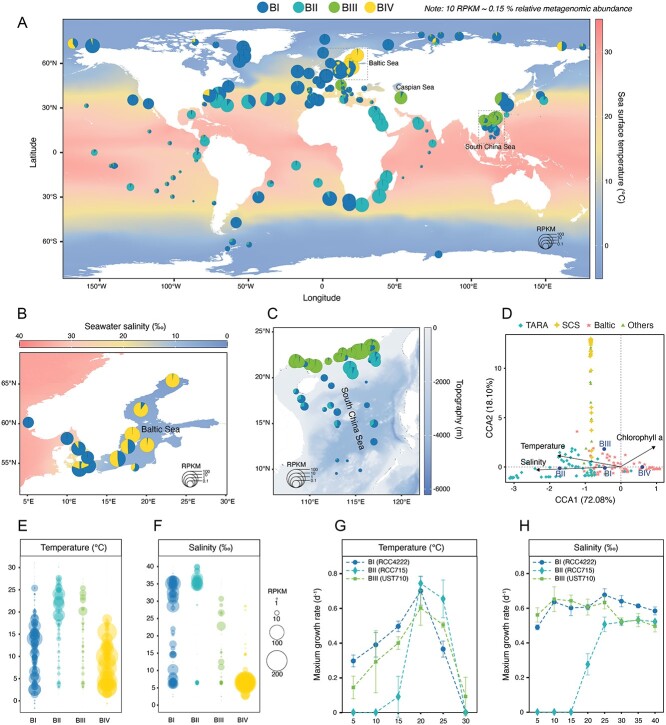
Figure 3.
Global biogeography of four Bathycoccus clades and their adaptation to temperature and salinity. (A–C) Distribution of Bathycoccus clades BI, BII, BIII, and BIV in the surface water of (A) global ocean, (B) the Baltic Sea, and (C) the SCS, as inferred from metagenomic read recruitment to reference genomes. The size of pie chart represents the relative abundance of all Bathycoccus in metagenomic samples, normalized as RPKM (reads per kilobase per million mapped reads). Each pie chart is divided into four sectors, corresponding to the proportion of each clade. The background gradients indicate (A) sea surface temperature, (B) seawater salinity, and (C) topography, respectively. (D) CCA illustrating the association between environmental parameters and the abundance of different Bathycoccus clades. Data from multiple published studies were included in the analysis, including TARA (Tara Oceans expedition), Baltic (Baltic Sea), SCS, and others (Yellow Sea, Caspian Sea, Chesapeake and Delaware Bay). Only parameters with a significant P value (P < 0.01) are shown. (E, F) Bubble plots illustrate the range of values for two environmental parameters, temperature (E) and salinity (F) for different Bathycoccus clades. The bubble size represents the genome abundance (normalized as RPKM). (G, H) Maximum growth rates measured in the laboratory under different temperature (G) and salinity (H) conditions, revealing specific growth responses to temperature and salinity for culturable Bathycoccus clades, BI (strain RCC4222), BII (strain RCC715), and BIII (strain UST710).

