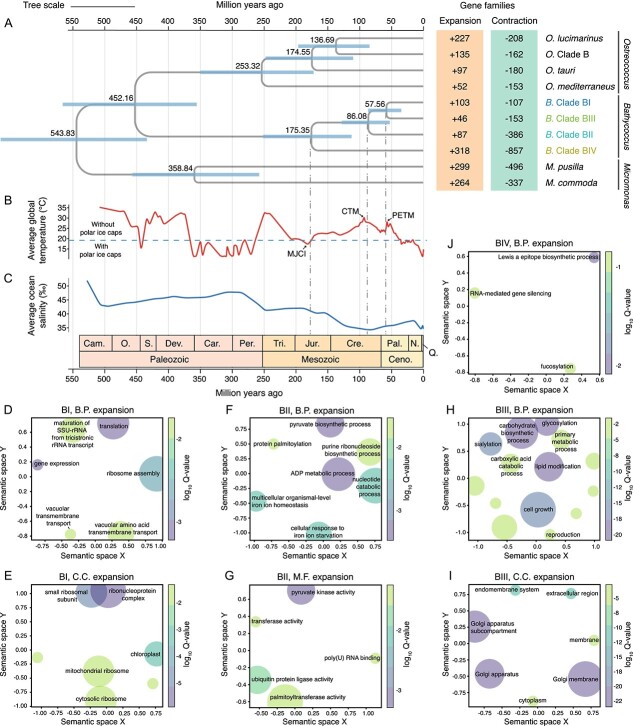
Figure 5.
Divergence history and gene family evolution within clades in Bathycoccus. (A) Left: a time-calibrated phylogenetic tree illustrating the divergence time of clades in Bathycoccus. The tree scale is 1. Divergence times (million years ago, Ma) were inferred using MCMCTree under an autocorrelated relaxed clock model. The mean and the 95% highest posterior density interval of the ages are shown above each node and represented by horizontal bars, respectively. The geologic time scale is based on the Geological Society of America. Abbreviations of geologic period: Cam., Cambrian; O., Ordovician; S., Silurian; Dev., Devonian; Car., Carboniferous; Per., Permian; Tri., Triassic; Jur., Jurassic; Cre., Cretaceous; Pal., Paleogene; N., Neogene; Q., Quaternary; Ceno., Cenozoic. Only the Mamiellophyceae section of the tree is shown (the full time-calibrated tree of the green lineage is provided in Fig. S6); right: evolutionary analyses of gene family expansions and contractions for each species or clade in Mamiellophyceae, with a focus on Bathycoccus. (B) Global average surface temperature over the past 500 million years (data source: Smithsonian National Museum of Natural History). Periods with temperature below (above) the horizontal dotted line indicate the presence or absence of persistent polar ice caps. The divergence times of Bathycoccus clades are approximated to coincide with several climatic events, including MJCI (174 to 164 Ma), CTM (94 to 82 Ma), and PETM (Paleocene-Eocene Thermal Maximum, 56 Ma). (C) Average ocean salinity over the past 500 million years (data source [61]). (D–J) Semantic similarity scatterplots of GO term enrichment (M.F., molecular function; B.P., biological process; C.C., cellular component) of the expanded gene families within the four Bathycoccus clades (BI, BII, BIII, and BIV). The plots were generated using the Python package GO-Figure, which clusters similar GO terms and selects one as representative. Circle sizes are scaled based on the number of terms they represent. Circles representing terms that are most similar in semantic space on axes X and Y are placed closest to each other. The gradient of each circle indicates the significance (log10 Q-value) of the corresponding GO term, with only the 10 most significant terms displayed. Full lists of terms and their groupings are available in Table S11.

