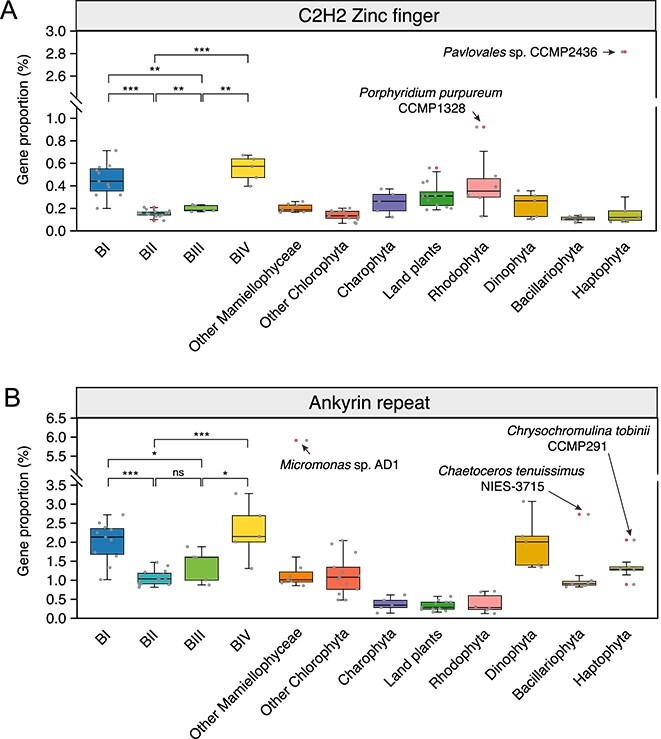
Figure 6.

Comparison of gene proportion of C2H2 zinc finger and ankyrin repeat protein families among genomes of eukaryotic phytoplankton and land plants. (A, B) The box plots show the proportions of C2H2 zinc finger (A) and ankyrin repeat (B) gene families in the genomes of the four Bathycoccus clades, other eukaryotic phytoplankton groups and land plants. For both box plots, the gene proportions in each genome are shown as standard dots, whereas distnct dots represent outlier values. Five eukaryotic phytoplankton with exceptionally high gene proportions (outlier values) are labeled. The gene proportion for both protein families were compared between different Bathycoccus clades, an asterisk (*) for a P-value <0.05, double asterisks (**) for a P-value <0.01, triple asterisks (***) for a P-value <0.001, and “ns” for no significant difference (Mann–Whitney U test).
