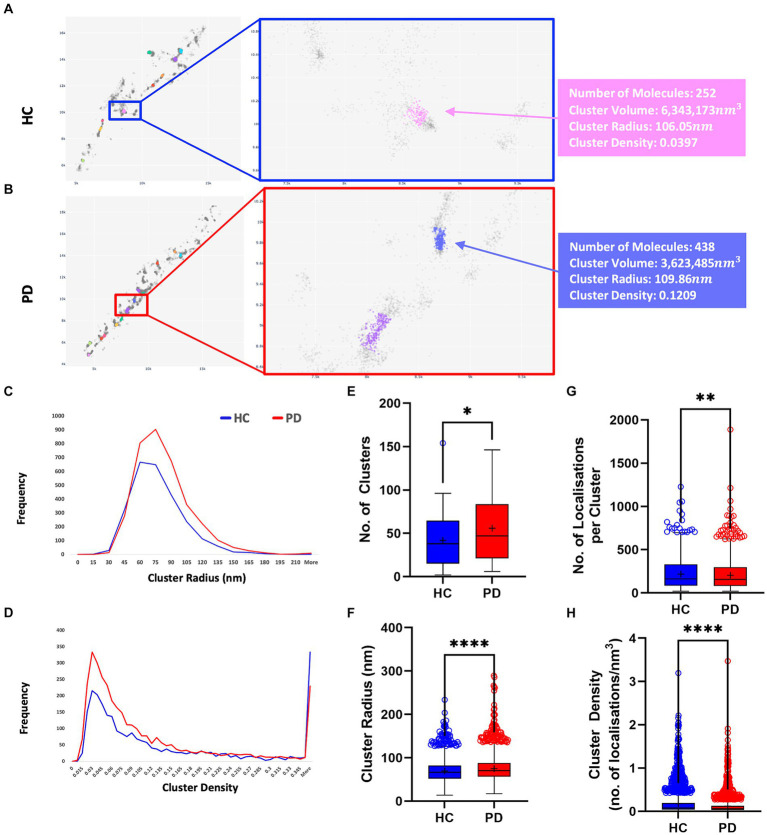
Figure 4.
PD patients display a higher number of aggregates compared to HC subjects. (A,B) Visualization of aggregates identified by FOCALPC2 in an HC subject (A) and a PD patient (B). (C) Distribution of aggregates’ radii shows that PD patient-derived images contain a larger number of aggregates with medium radii than do HC subject-derived images. (D) Distribution of aggregates’ densities shows that PD patient-derived images display a larger number of aggregates with low-medium densities. (E) Number of aggregates is significantly higher in PD patients than in HC subjects [means – HC: 42.45, PD: 55.92]. (F) Radii of aggregates are significantly larger in PD patients than in HC subjects [means – HC: 69.43, PD: 74.98]. (G) Densities of aggregates are significantly higher in HC subjects than in PD patients [means – HC: 0.1785, PD: 0.1263]. (H) Number of localizations per aggregates is significantly higher in HC subjects than in PD patients [means – HC: 217.66, PD: 203.68]. The mean percentage of localizations identified as aggregates in HC subjects is 20.3% and in PD patients is 21.6%. Means are marked with a + sign, and the 25th percentile, median, and 75th percentile are marked by the bottom, middle, and top black lines outlining the whisker box, respectively. Each outlier data point is marked with a diamond. *p < 0.05, **p < 0.01, ****p < 0.0001.

