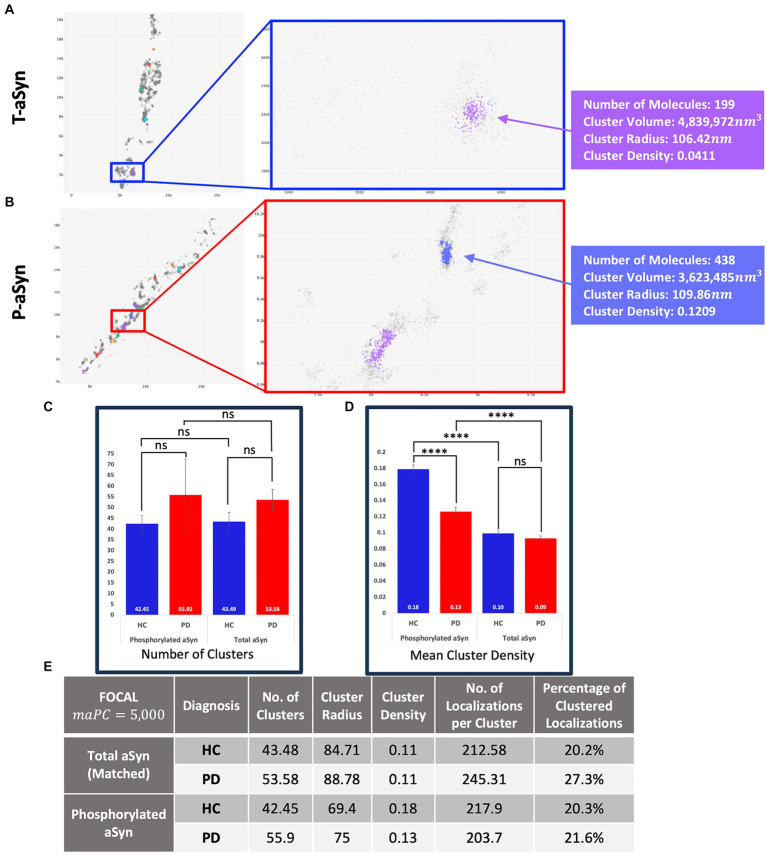
Figure 5.
t-aSyn aggregates are larger and less dense compared to p-aSyn aggregates in both PD patients and HC subjects. Comparison of t-aSyn and p-aSyn clustering in PD patients and HC subjects using FOCALPC2. (A,B) Visualizations of clusters of t-aSyn (A) and p-aSyn in a PD patient (B). (C–E) t-aSyn aggregates are larger and less dense compared to p-aSyn aggregates for both PD patients and HC subjects. ****p < 0.0001.

