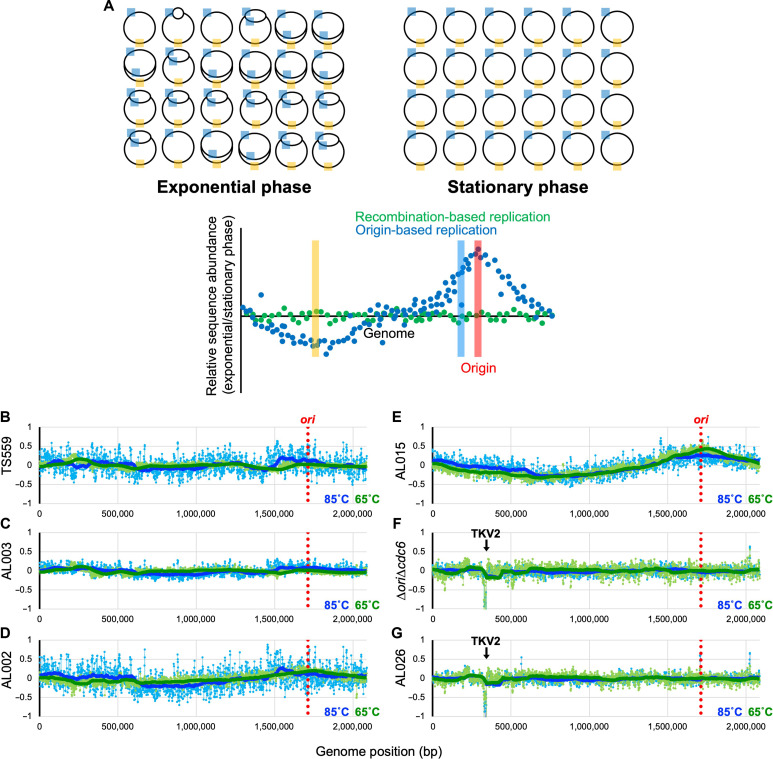
Fig. 6. Impaired intein excision elicits a radical shift of replication strategies.
(A) Overview of MFA. The T. kodakarensis genome is shown by a black circle, with cyan and orange boxes denoting generic regions in the genome proximal and distal, respectively, to the ori. When ODR prevails as the dominant replicative strategy, DNA isolated from actively replicating cultures during exponential phase retains an overrepresentation of the DNA regions closest to the ori (cyan) and an underrepresentation of regions of DNA located distantly from the ori (orange). When the frequencies of DNA sequences from replicating cultures are compared to the frequencies of DNA sequences from nonreplicating cultures of the same strain in stationary phase, MFA permits identification of any areas of the genome that are overrepresented in replicating cells, with the peak defining a replication origin. The hypothetical blue scatter plot displays the anticipated wave pattern with a single apex at the predicted origin that would be anticipated from cultures wherein ODR dominates. In contrast, when RDR dominates within a growing culture, MFA will not reveal any sequence enrichment and will be consistent with the hypothetical green scatter plot. (B to G) Strains were grown at 85°C (blue) and 65°C (green), and DNAs were purified from cells harvested at both mid-exponential and stationary phase. MFA reports the log2 ratio of the mapped reads from exponentially growing cells divided by reads from stationary cultures. A 100-period moving average is plotted using the thick blue/green solid lines to show the trend from the MFA. The genome of T. kodakarensis was segregated into 1000-bp bins. The location of the ori-cdc6 region is indicated by the red dotted line. The downward arrow in (F) and (G) represents the location of the TKV2-excised region.

