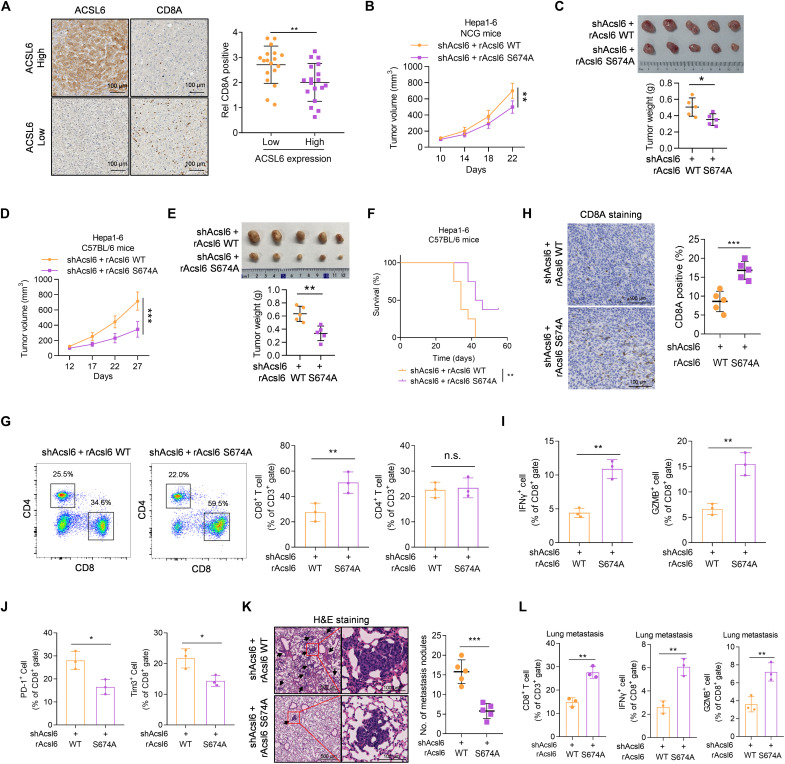
Fig. 6. ACSL6 pS674 drives liver cancer immune evasion.
(A) IHC staining and quantification showing the inverse correlation between ACSL6 expression and CD8A levels in patients with liver cancer. (B and C) Subcutaneous injection of Acsl6-depleted Hepa1-6 cells with forced expression of rAcsl6 WT and S674A into NCG mice. Tumor volumes (B) and tumor images and weights (C) in the xenograft model. (D to J) Subcutaneous injection of Acsl6-depleted Hepa1-6 cells with forced expression of rAcsl6 WT or S674A into C57BL/6 mice. Tumor volumes (D), tumor images and weights (E), and survival rates (F) are shown. Flow cytometry analyses of tumor-infiltrating CD8+ and CD4+ T cells (G). IHC staining analyses of CD8A levels (H). Flow cytometry analyses of tumor-infiltrating IFN-γ+CD8+ and GZMB+CD8+ T cells (I) and tumor-infiltrating PD-1+CD8+ and Tim3+CD8+ T cells (J) in indicated tumors. (K and L) Representative images of H&E staining and statistics of metastatic lung nodules (K) and flow cytometry analyses of tumor-infiltrating CD8+ T cells, IFN-γ+CD8+ T cells, and GZMB+CD8+ T cells (L) from C57BL/6 mice injected with Acsl6-depleted Hepa1-6 cells with forced expression of rAcsl6 WT and S674A. [(B) to (E)] n = 5; (F) n = 10. *P < 0.05, **P < 0.01, and ***P < 0.001. Student’s t test [(A), (C), (E), and (G) to (L)], two-way ANOVA [(B) and (D)], and log-rank test (F).

