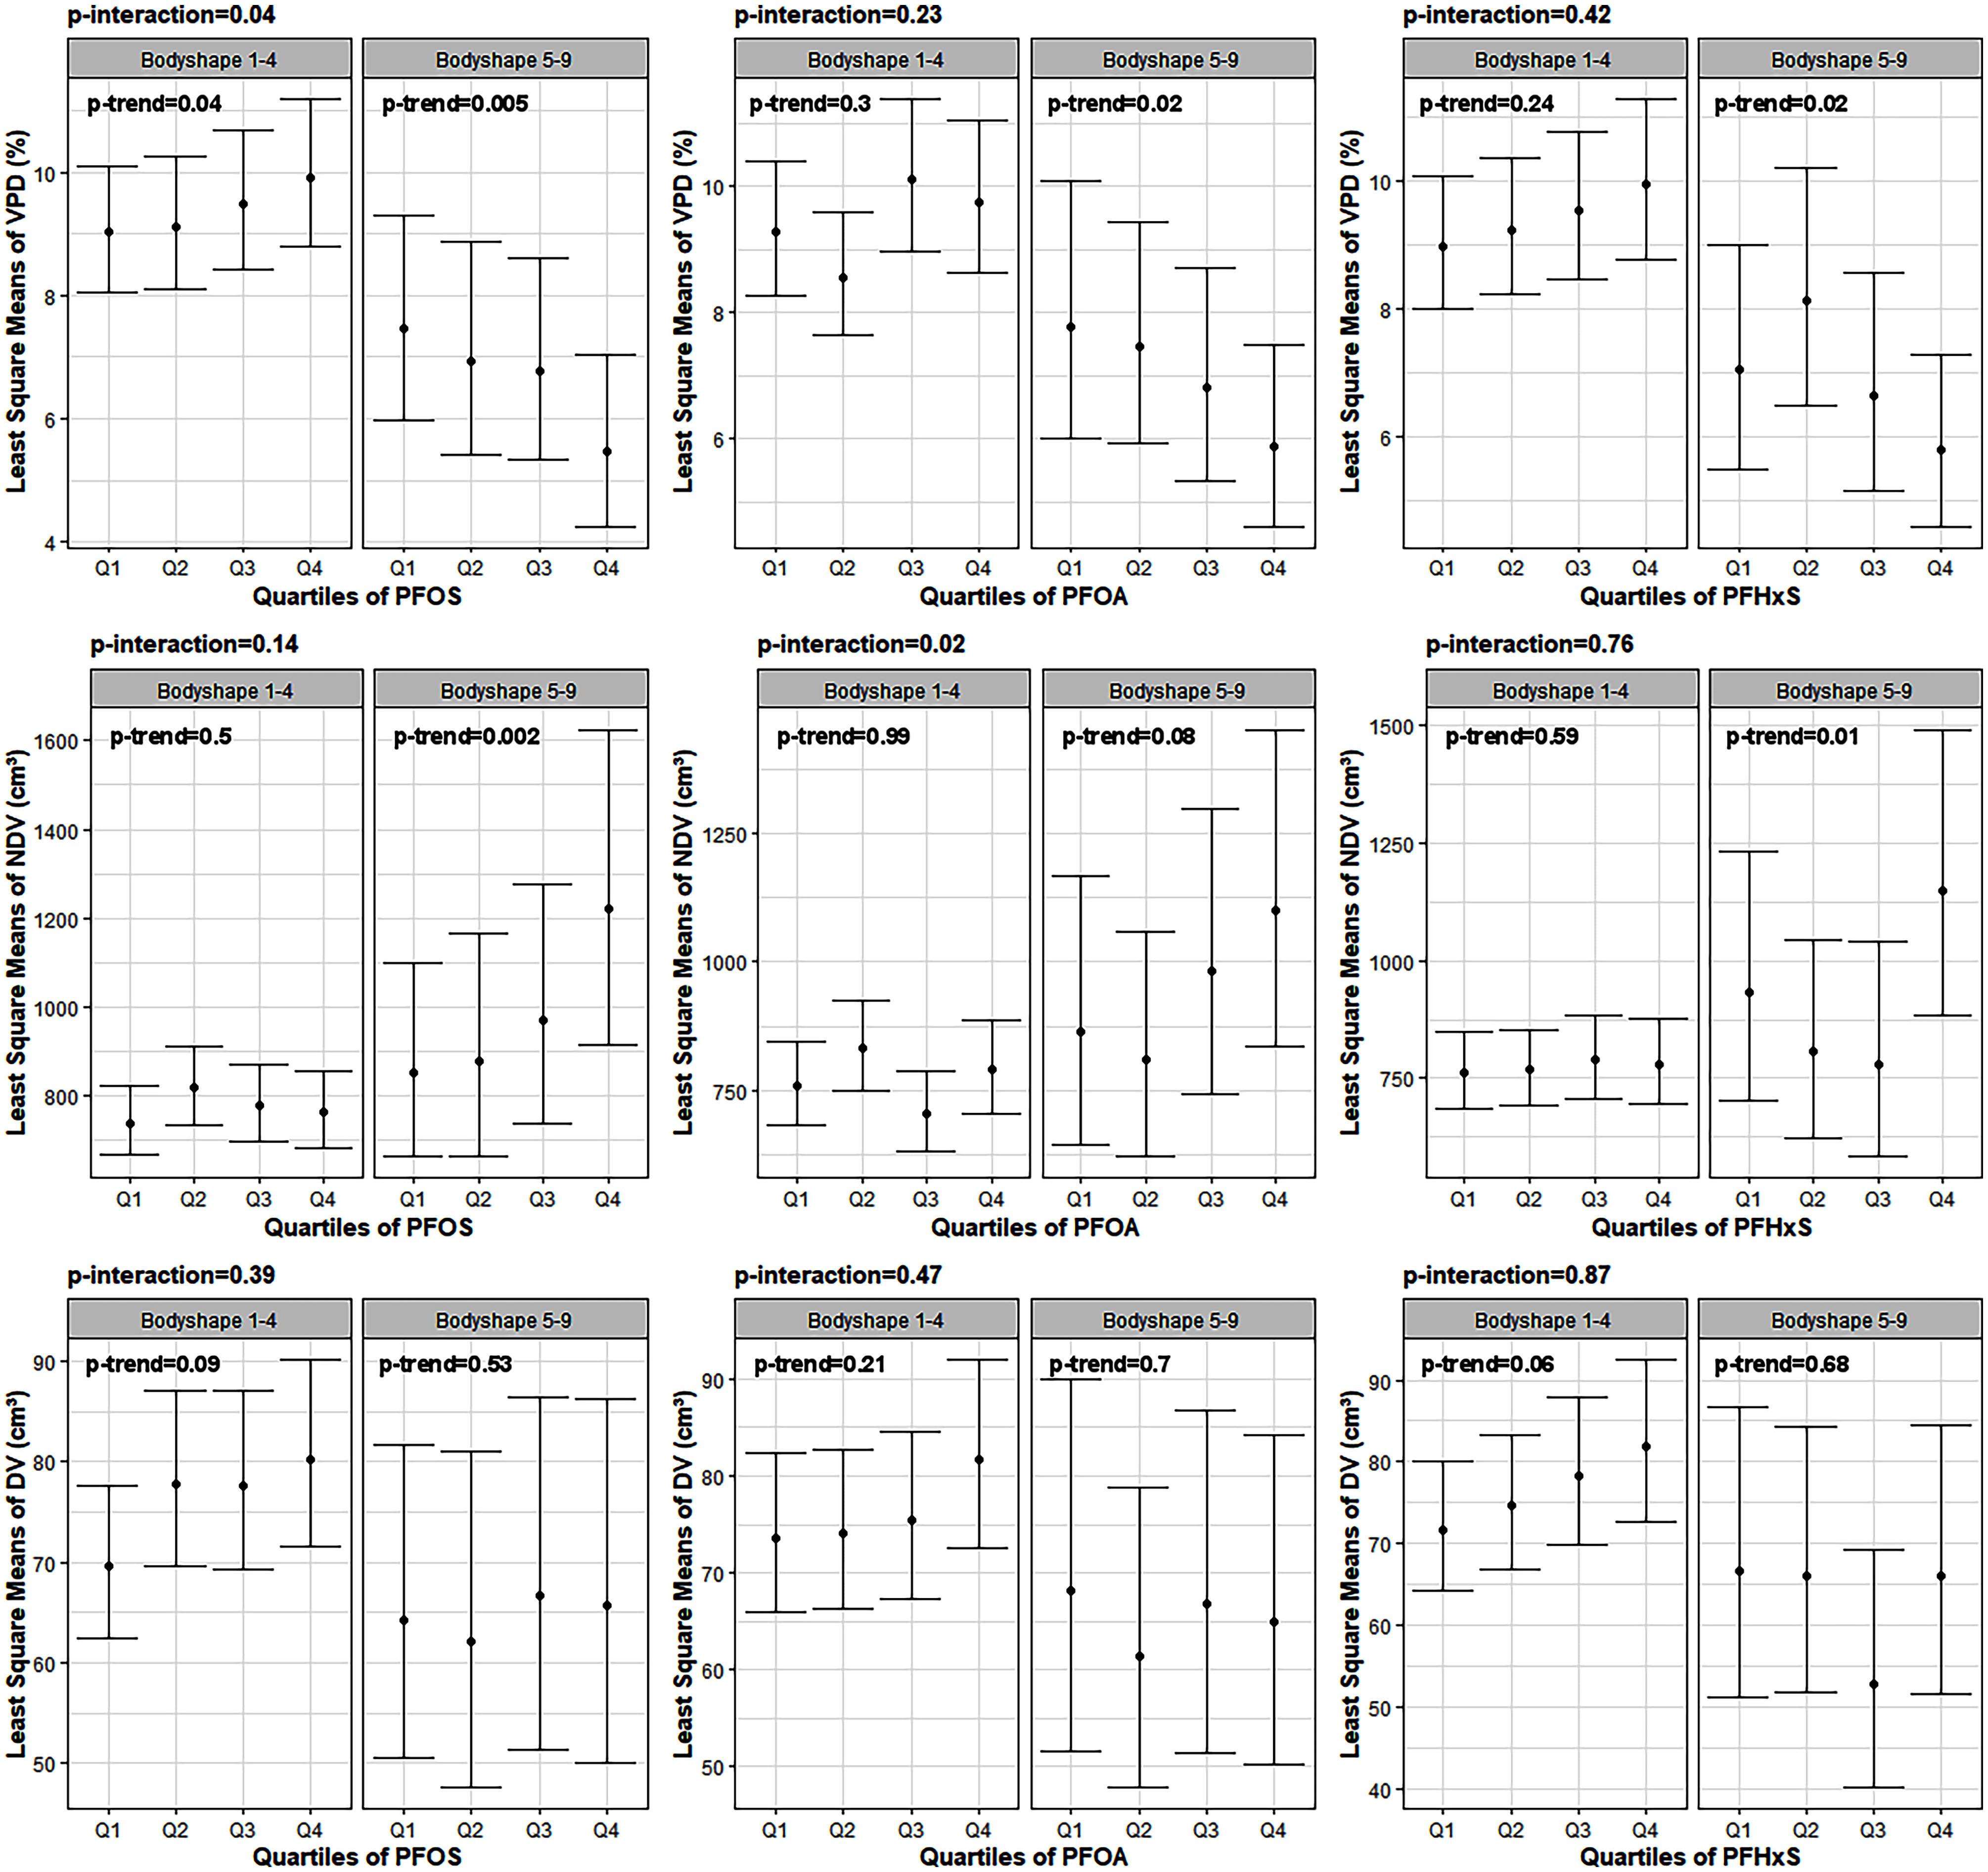
Figure 1.

PFOS, PFOA, and PFHxS levels and covariate-adjusted least square means of mammographic breast density (MBD) stratified by body shape at age 10 (underweight/normal weight vs. overweight/obese) in 700 premenopausal women who completed their annual screening mammogram at Washington University School of Medicine (St. Louis, Missouri) from December 2015 to October 2016 and from September 2020 to February 2022. Note: Multivariable linear regression models were performed to calculate adjusted least square means of MBD (VPD, NDV, DV) by quartile of PFAS (PFOS, PFOA, PFHxS) separately for women who reported an underweight/normal weight body shape at age 10 (1–4) and women who reported an overweight/obese body shape at age 10 (5–9) based on the Stunkard pictogram. for trend values are presented to assess significance across the quartiles within each group and -interaction to see if the relationship between PFAS and MBD within each strata were different. All models adjusted for age, age at menarche, body fat percentage, race, family history of breast cancer, oral contraceptive use, alcohol consumption, and parity/age at first birth. Measures of MBD were transformed and coefficients back-transformed (). DV, dense volume; NDV, nondense volume; PFAS, per- and polyfluoroalkyl substances; PFHxS, perfluorohexane sulfonate; PFOA, perfluorooctanoic acid; PFOS, perfluorooctane sulfonate; Q1–Q4, Quartiles 1–4; VPD, volumetric percent density. Body shape at age 10 (1–4, ) quartile ranges (minimum, maximum): PFOS: Q1 (0.09, 1.81), Q2 (1.81, 2.70), Q3 (2.70, 4.22), Q4 (4.22, 31.3); PFOA: Q1 (0.13, 0.78), Q2 (0.78, 1.24), Q3 (1.24, 1.85), Q4 (1.85, 34.5); PFHxS: Q1 (0.09, 0.70), Q2 (0.70, 1.10), Q3 (1.10, 1.71), Q4 (1.71, 10.6). Body shape at age 10 (5–9, ) quartile ranges (minimum, maximum): PFOS: Q1 (0.27, 1.84), Q2 (1.84, 2.80), Q3 (2.80, 4.07), Q4 (4.07, 11.2); PFOA: Q1 (0.10, 0.78), Q2 (0.78, 1.15), Q3 (1.15, 1.69), Q4 (1.69, 4.98); PFHxS: Q1 (0.12, 0.64), Q2 (0.64, 1.13), Q3 (1.13, 1.69), Q4 (1.69, 6.52). Quartile values shown are . All numeric data used to generate these figures can be found in Table S7.
