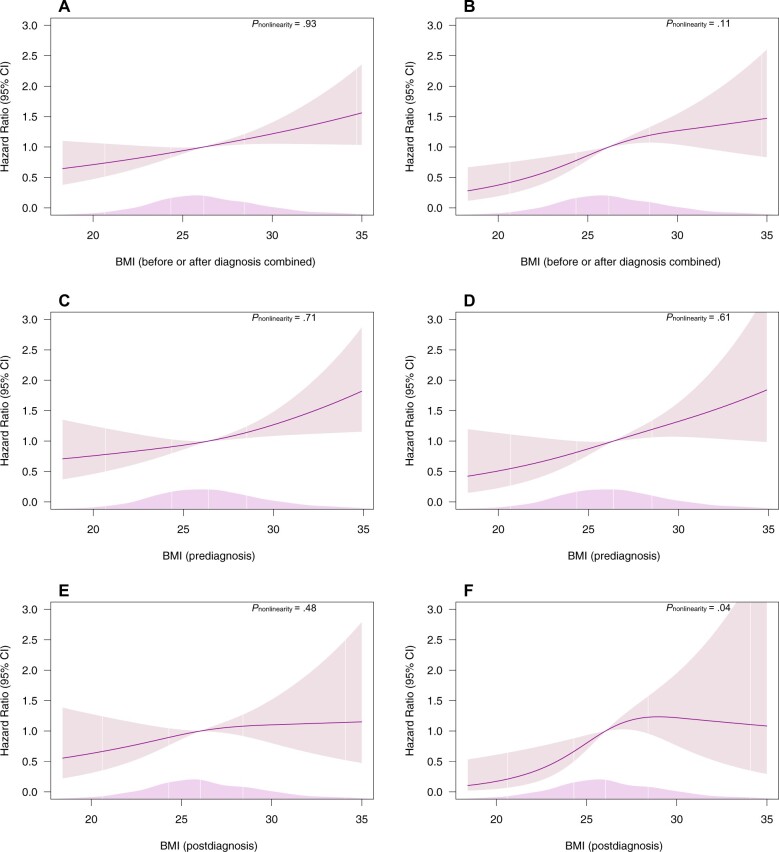
Figure 2.
Hazard ratios from Cox proportional hazards models with restricted cubic spline curves describing the association between BMI data collected before or after diagnosis combined and (A) all-cause mortality (men/deaths = 972/320); (B) prostate cancer–specific mortality (men/deaths = 972/163), prediagnosis BMI; (C) all-cause mortality (men/deaths = 570/194); (D) prostate cancer–specific mortality (men/deaths = 570/100), postdiagnosis BMI; (E) all-cause mortality (men/deaths = 372/126); (F) prostate cancer–specific mortality (men/deaths = 372/63). Hazard ratios are based on the main model, adjusted for age at diagnosis, year of diagnosis, disease stage, tumor grade, and smoking status; knots at the 10th, 50th, and 90th percentiles of BMI. The median BMI of the individuals included in analyses was used as the referent: 26.2 in the prediagnosis or postdiagnosis BMI analysis, 26.5 in the prediagnosis BMI analysis, and 25.9 in the postdiagnosis BMI analysis. The smooth density plot represents the density of the population across the spline variable. BMI = body mass index; CI = confidence interval.

