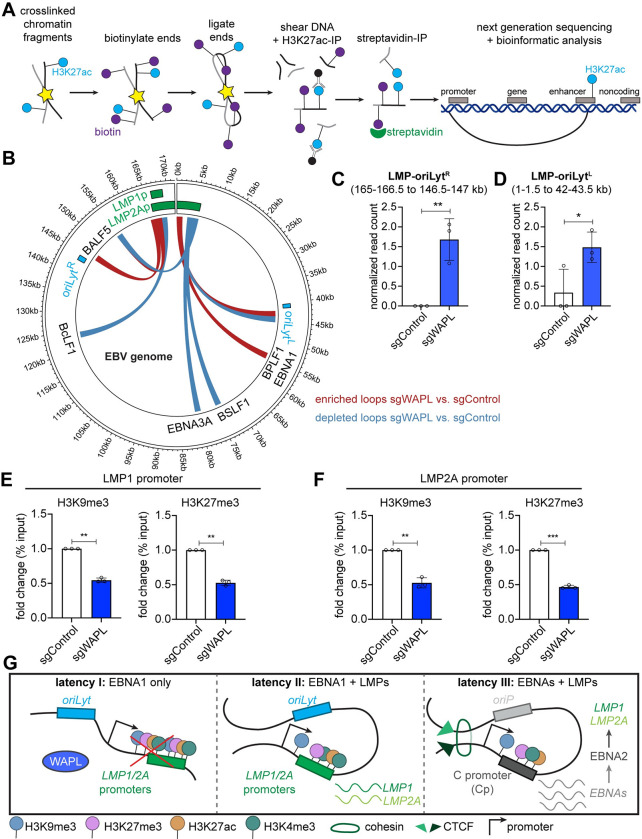
Fig 4. WAPL KO alters latency I Burkitt EBV genomic activated chromatin loops and represses LMP promoter epigenetic marks.
(A) Schematic of H3K27ac HiChIP sample preparation and output. Chromatin was formaldehyde crosslinked and fragmented. Exposed DNA ends were biotinylated and then ligated to capture close DNA contacts. Ligated DNA was sheared, DNA was immunopurified by α-H3K27ac antibody, and biotinylated DNA was captured via streptavidin. (B) EBV genomic H3K27ac HiChIP map depicting loops enriched (red) or depleted (blue) in Cas9+ MUTU I cells expressing WAPL vs. control sgRNAs, from n = 3 biological replicates. (C-D) Normalized (C) LMP region-oriLytR loop and (D) LMP region-oriLytL loop read counts from n = 3 replicates, as in (B). EBV genome kilobase coordinates for each looping region are indicated at top. * P ≤ 0.05, ** P ≤ 0.01, as calculated by a two-tailed Student’s t-test. (E-F) ChIP-qPCR analysis of H3K9me3 and H3K27me3 abundances at the (E) LMP1 promoter and (F) LMP2A promoter in Cas9+ MUTU I cells expressing control or WAPL sgRNAs. Shown are the mean fold change of ChIP-qPCR values relative to input values ± SD from n = 3 biological replicates. Values from sgControl expressing cells were normalized to 1. ** P ≤ 0.01, *** P ≤ 0.001, as calculated by a two-tailed Welch’s t-test. (G) Model of WAPL effects on EBV genomic architecture. When present, WAPL releases cohesin (latency I), which enables the accumulation of repressive histone marks and inhibits LMP expression. In the absence of WAPL antagonism, a loop forms between the LMP promoter region and oriLyt regions. Juxtaposition of the oriLyt enhancer reduces repressive H3K9me3 and H3K27me3 marks and supports LMP1 and LMP2A co-expression in the absence of EBNA2 (latency II). For reference, in latency III, an alternative loop forms between the oriP and the Cp to drive expression of all the EBNA genes.

