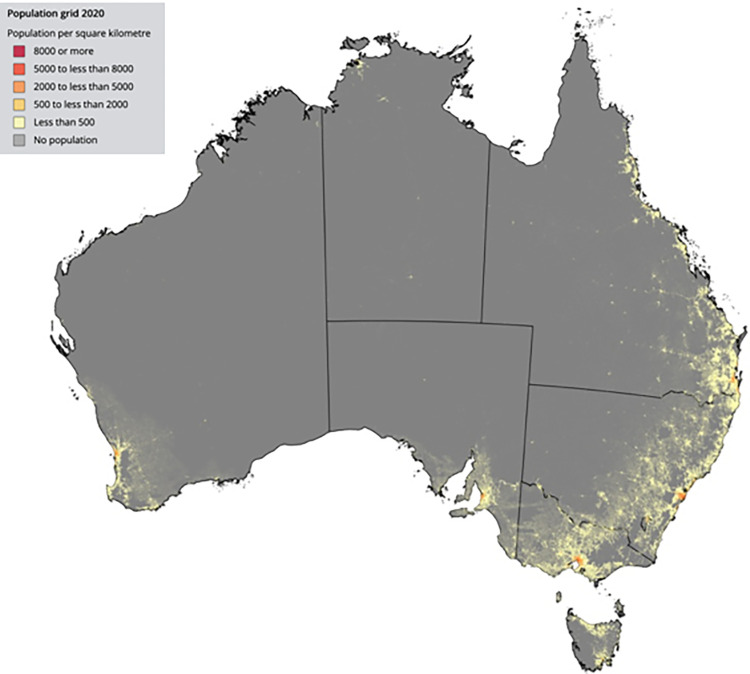
Fig 4. Population geographic distribution of Australia; Regional population 2019–20: Population Grid from Australian Bureau of Statistics [29].
Crude seroprevalence of S-antibody was 1833/2045 (89.6%) and N-antibody 1309/2046 (64.0%). After adjustment for age, vaccination status, socioeconomic quintile and remoteness index, seroprevalence for S- antibody was 92.1% (95% CrI 91.0–93.3) and N-antibody 67.0% (95% CrI 64.6–69.3).

