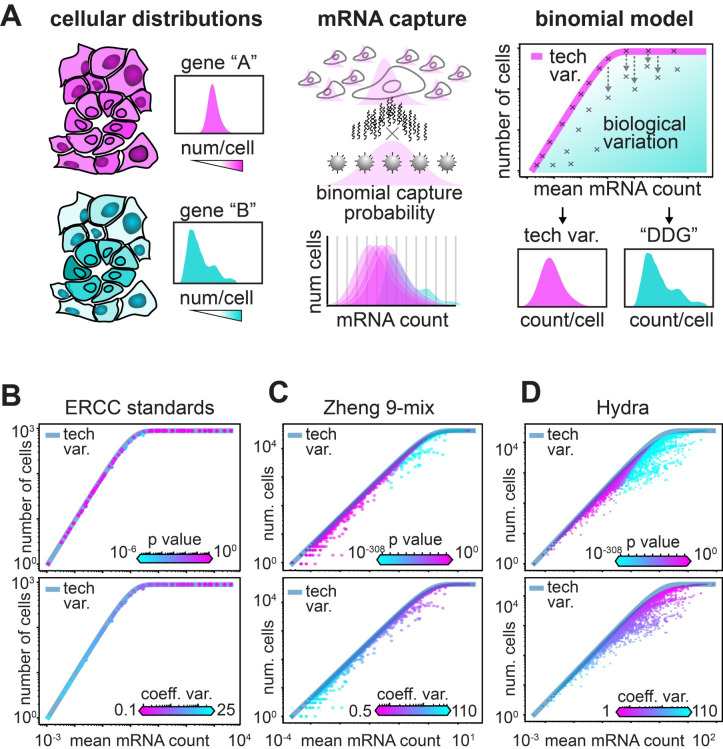
Fig 2. A binomial model of mRNA capture identifies genes expressed in fewer cells than expected.
A) Schematic of the null model for biologically varying genes. The first panel illustrates uniformly (pink) and differentially (cyan) distributed gene expression across a sample of cells, with illustrated histograms of each gene’s count distribution across the set of cells. The second panel illustrates the mRNA capture as a binomial process, where the probability of capture for each mRNA is stochastic. The third panel depicts the expected relationship of the average mRNA level and the number of cells each gene is observed in, where each ‘x’ on the graph represents a specific gene. The pink line illustrates the expected relationship if the only variation that is observed arises from the binomial sampling process. B-D) Scatter of average mRNA count per gene versus the number of cells each gene is identified in for three datasets: B) the synthetic ERCC data, C) the Zheng-9 lymphocytes, and D) the Hydra. In the top panel each gene is colored by the P-value computed from the DDG model, while in the bottom panel each gene is colored by the coefficient of variation.

