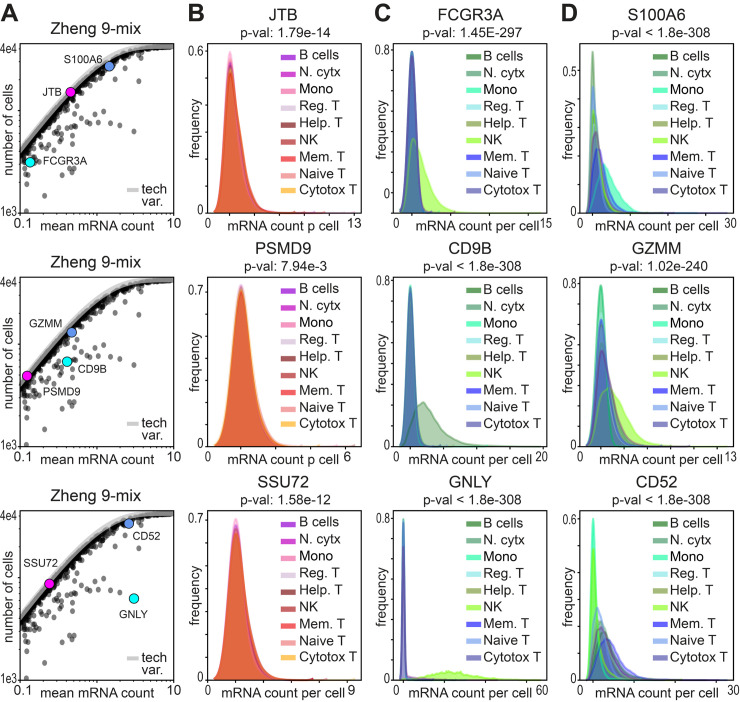
Fig 3. Identification of differentially distributed mRNAs reveals different modes of expression variation.
A) Scatter of average mRNA count per gene versus the number of cells each gene is identified in for the lymphocyte data, cropped to highlight the three example genes depicted across the row. B-D) Kernel density estimation for the distribution of gene counts across cells in the lymphocyte data. The distribution of each gene is plotted for each cell type separately. In each column three example gene distributions are depicted to show B) genes that are not significantly differentially distributed, C) genes that are differentially expressed in specific cell types, and D) genes that quantitatively vary both across and within cell types.

