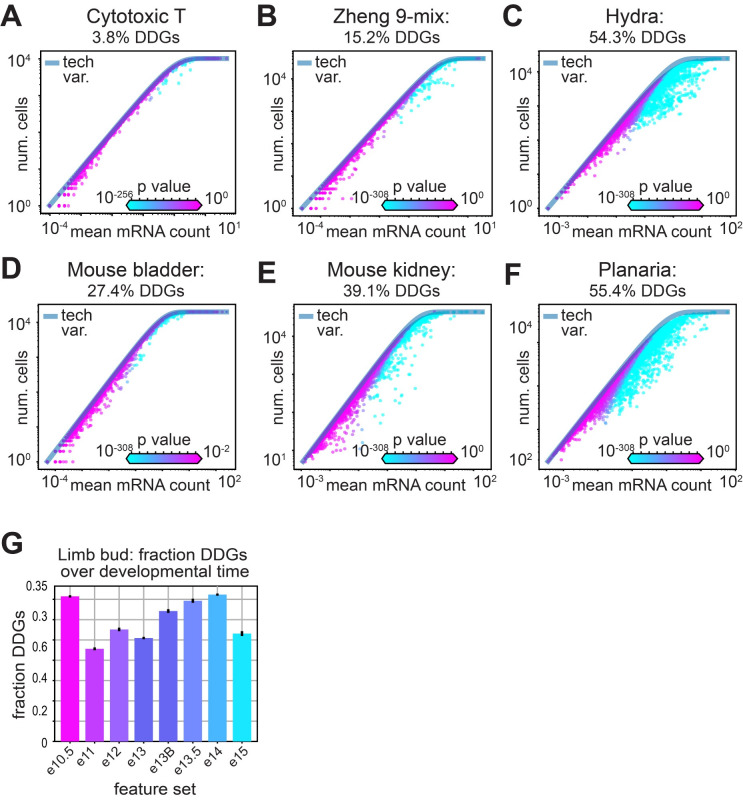
Fig 4. Greater tissue complexity produces a greater fraction of differentially distributed genes.
A-F) Scatter of average mRNA count per gene versus the number of cells each gene is identified in for the lymphocyte data, where each gene is colored by the computed p-value. The fraction of significantly distributed genes is indicated for A) cytotoxic T cells, B) the Zheng-9 lymphocyte mix, C) hydra, D) mouse bladder, E) mouse kidney, and F) planaria. G) Mean fraction of DDGs over developmental time in mouse limb bud data. Error bars show confidence interval around the mean, estimated using the 10 re-sampled sets.

