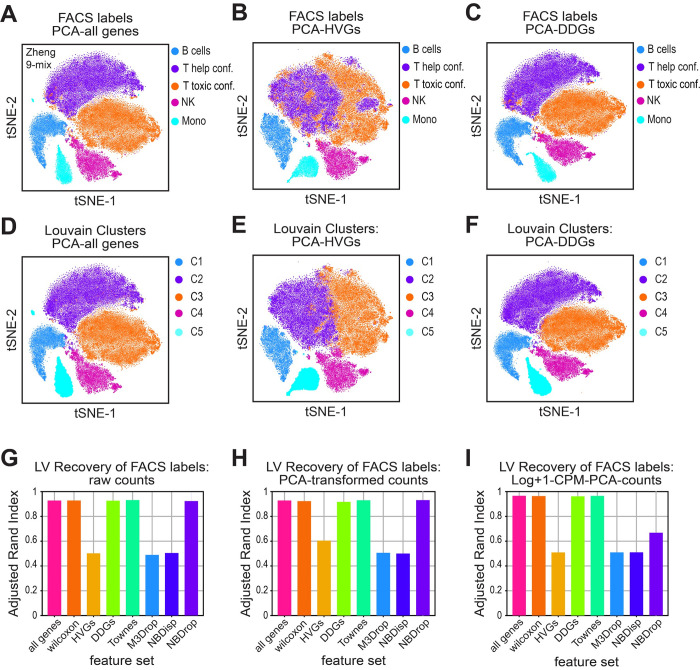
Fig 7. DDGs recover cellular identities of FACS-labeled lymphocytes.
A-F) tSNE projections for dimensionality-reduced data from the Zheng-9 lymphocyte mix. Principal component analysis was used to reduce (A,D) all genes, (B,E) HVGs, or (C,F) DDGs. Cells are either colored by original FACS-based set membership, where T-cell lineages were merged into two super sets (A-C), or Louvain cluster membership (D-I). G-I) Quantification of FACS label recovery by various methods of dimensionality reduction across different feature sets. Louvain clustering was performed across a titration of resolution parameters, cluster labels were compared to original FACS labels where T-cell lineages were merged into two super sets, and the highest adjusted rand index is plotted when G) raw UMI counts, H) PCA-transformed counts, or F) Log+1-CPM-PCA-counts were used as a basis.

