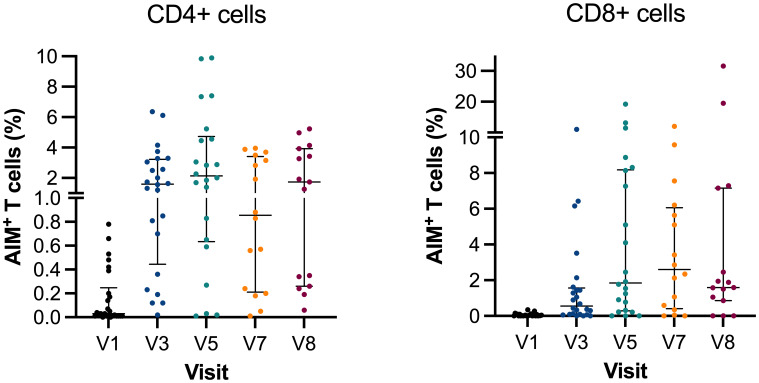
Figure 3.
Activation-induced markers of CD4+ and CD8+ T cells. Scatter plot graph depicting frequencies of spike-reactive CD4+ and CD8+ cell median with IQR at V1, V3, V5, V7, and V8. Y-axis in two segments ranging 0%–1% and 1%–10% for CD4+ and 0%–10% and 10%–30% for CD8+. AIM, activation-induced markers of positive T cells.

