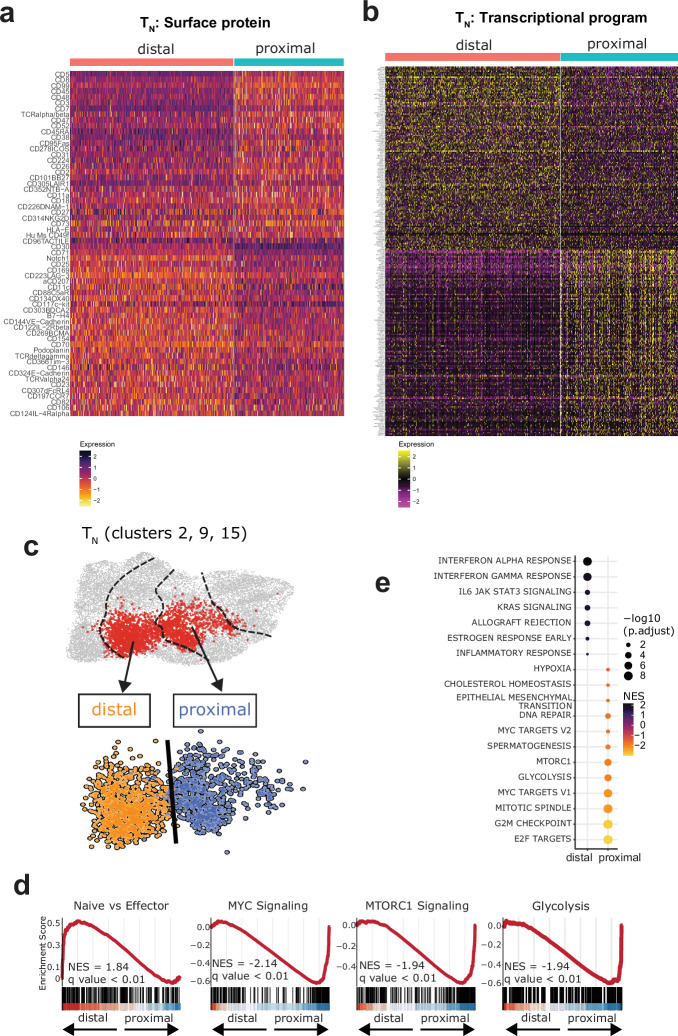
Extended Data Fig. 7. TN-like proximal-daughter and distal-daughter CD8 CARTs exhibit asymmetry in surface proteomic and transcriptional landscapes that drive differentiation and metabolic programs.
a-b, Heat maps for first-division TN-like CARTs of (a) normalized surface protein levels of the top 30 proteins enriched in either distal-daughter (top half) or proximal-daughter (bottom half) TN-like CARTs and (b) normalized gene expression of top enriched genes in distal-daughter (top half) and in proximal-daughter (bottom half) TN-like CARTs demonstrate asymmetry in surface proteome and transcriptional abundance between first-division proximal-daughter and distal-daughter TN-like CARTs. c, Proximal-daughter and distal-daughter CD8 TN clusters (2, 9,15) characterized in Fig. 5c,d. d, Gene-set enrichment plots comparing transcriptional programs of proximal-daughter and distal-daughter TN-like CD8 CARTs, indicating enrichment of naïve-associated genes in distal-daughter TN-like CD8 CARTs (positive enrichment score values) and enrichment of genes associated with MYC, MTORC1 signaling, and glycolysis in proximal-daughter TN-like CD8 CARTs (negative enrichment score values). e, Hallmark transcriptional programs of proximal-daughter and distal-daughter TN-like CARTs. Statistical significance was determined using GSEA test with Benjamini–Hochberg correction for multiple comparisons. Plots are representative of 2 independent experiments with distinct donors: one with the anti-TCRδ CAR (shown in this figure) and one with the anti-CD19 CAR.

