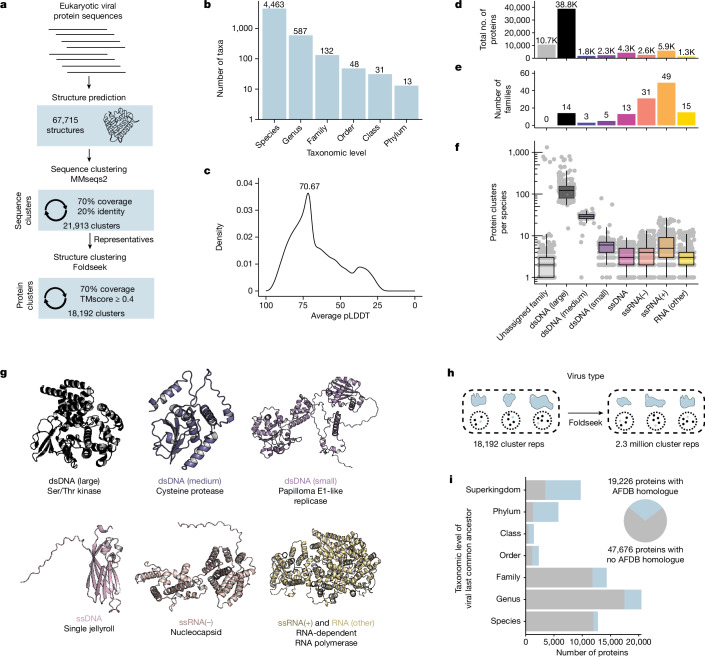
Fig. 1. The structural proteome of eukaryotic viruses.
a, Pipeline for protein clustering. Protein sequences from eukaryotic viruses were folded using ColabFold. Protein sequences were clustered to 70% coverage and 20% identity. The predicted structures of the representatives of each cluster were then aligned and clustered together with a requirement of 70% coverage across the structural alignment and a TMscore ≥0.4. This resulted in a final set of 18,192 clusters. b, Taxonomic distribution of the dataset. Each column indicates the number of taxa present. c, Distribution of the average pLDDT of all structures in the dataset. d–f, Viral families were classified by genome type, and the total number of proteins (d), viral families (e) and protein clusters per species (f) are indicated. In box plots, the centre line is the median, box edges delineate 25th and 75th percentiles, and whiskers extend to the highest or lowest point up to 1.5 times the inter-quartile range. g, Protein structures representing the protein cluster that is encoded by the highest number of viral families of each genome type. h, Foldseek was used to align a single representative protein from each viral protein cluster against 2.3 million clusters generated from the AlphaFold database. i, Left, taxonomic level of the last common ancestor of each viral protein cluster was determined. For example, if a protein cluster is encoded by viruses from different orders but the same class, they are placed in the class row. Blue indicates that proteins belong to a cluster with an analogue in the AlphaFold database (AFDB), whereas grey indicates that proteins belong to a cluster without an analogue in the AlphaFold database. Right, pie chart indicating the total number of proteins that belong to clusters whose representatives aligned to the AlphaFold database (blue) or did not align (grey).

