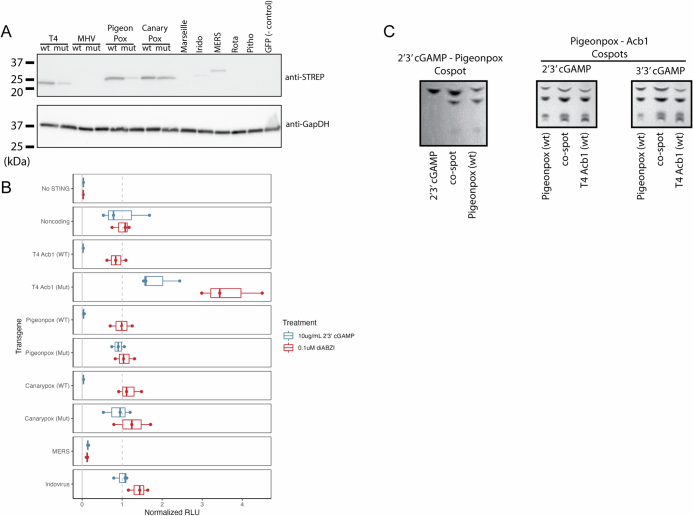
Extended Data Fig. 8. Activity of viral PDEs against 2’3’ cGAMP.
A. Western blot of 293 T cells following transfection of each viral LigT-like PDE. Each LigT-like PDE contains two STEP2 tags, and were visualized using an anti-STREP antibody. This blot is representative of two independent experiments. For gel source data see Supplementary Fig. 1. B. This experiment was conducted as illustrated in Fig. 4c. The X axis indicates the relative RLU normalized to the Noncoding transgene condition for each STING agonist (either 2’3’ cGAMP or diABZI).”Mut” indicates the transgene contains mutations of both catalytic histidines. Boxplots indicate 25th, 50th, and 75th percentiles, while whiskers go to the highest or smallest point up to 1.5 * interquartile range. Plotted data are from one biological replicate and three wells per condition. C. Thin-layer chromatography of co-spots between different conditions. (Left) Co-spotting of 2’3’ cGAMP and the Pigeonpox/2’3’cGAMP reaction. (Middle) Co-spotting of the Pigeonpox (WT)/2’3’ cGAMP reaction and the Acb1 (WT)/2’3’ cGAMP reaction. (Right) Co-spotting of the Pigeonpox (WT)/3’3’ cGAMP reaction and the Acb1 (WT)/3’3’ cGAMP reaction.

