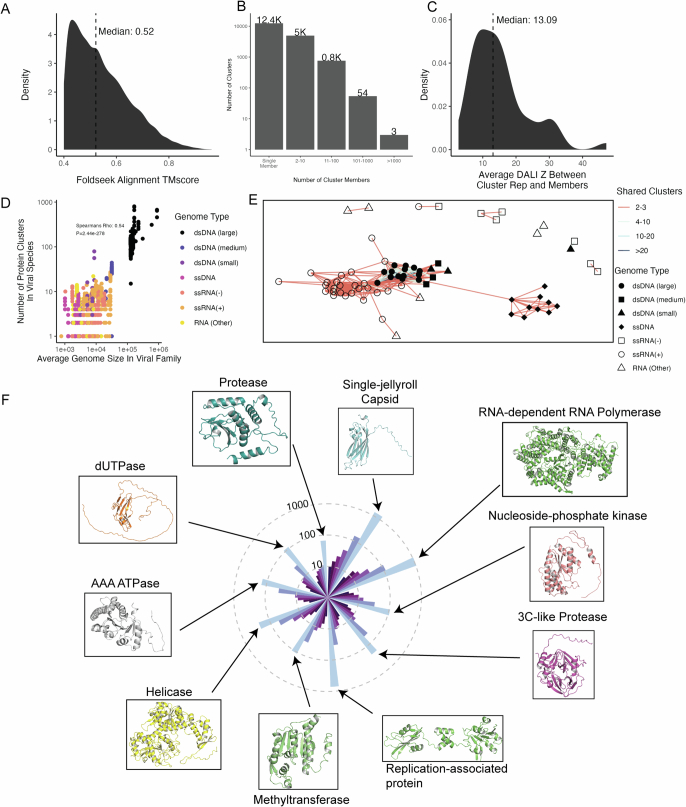
Extended Data Fig. 1. Distribution of protein clusters across viral families.
A. Foldseek was used to align all virus sequence cluster representatives against one another, and alignments with a TMscore below 0.4 were removed. This plot shows the distribution of alignment TMscores, with the X axis indicating the TMscore and the Y axis indicating the density (or “proportion”) or alignments with each TMscore. B. The distribution of proteins amongst sequence clusters. The X axis indicates the size of each cluster, while the Y axis indicates the number of clusters of that size. C. For each protein cluster with at least 100 members, the cluster representative was aligned with DALI against all cluster members. Clusters that contained members with an average length of 150 residues or less were excluded, and members that did not align to the representative were assigned a Z score of 0. The distribution of average Z scores for each cluster is plotted, with the median cluster-averaged indicated. X axis indicates the DALI Z score for each cluster, while the Y axis indicates the density (or proportion) of clusters with each average DALI Z score. D. Relationship between the number of protein clusters encoded by a viral species (Y axis) and the average genome size of its family in nucleotides (X axis). Each dot is a viral species, and colors indicate the genome type. The spearman’s (two-sided) Rho is 0.54, with a P value < 2.2e-16, indicating a strong correlation. E. Each node represents a single viral family, with the shape and color indicating the genome type of that family. The color of edges between the nodes indicates the number of shared protein clusters between each pair of families. Only those family-family pairs with at least 2 shared protein clusters are plotted. F. Protein clusters were ordered by their phylogenetic diversity of their members (e.g. # phyla > # classes > # orders >… # species) and the top 10 clusters were plotted. Bars are colored based and ordered on decreasing taxonomic level, with phyla as dark blue on the far left and species as bright blue on the far right of each stack.

