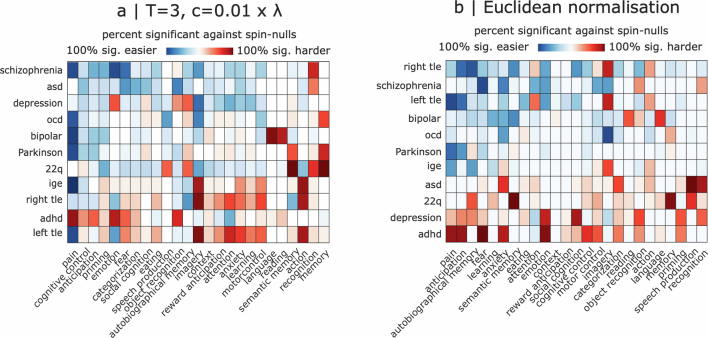
Extended Data Fig. 5. Effects of cortical thickness changes associated with each diagnostic category, for alternative operationalisations of network control theory.
Heatmap shows how each diagnostic category reshapes the transition energy required to reach a given cognitive topography, presented as the percentage of transitions (out of all possible initial cognitive topographies) that are significantly facilitated (blue colour scale) or significantly dis-facilitated (red colour scale). Significance is assessed against a null distribution of randomly rotated cortical thickness alteration maps with preserved mean, variance, and spatial autocorrelation, such that the only differences with the original map are the neuroanatomical locations of increases and decreases. (a) For network control with time horizon T = 3 and network normalisation factor c = 0.01 × |λ(A)max | ; (b) for network control with all NeuroSynth maps normalised to unit Euclidean norm. adhd = attention deficit/hyperactivity disorder; asd = autistic spectrum disorder; ocd = obsessive-compulsive disorder; ige = idiopathic generalised epilepsy; right tle = right temporal lobe epilepsy; left tle = left temporal lobe epilepsy. Source data are provided as a Source Data file.

