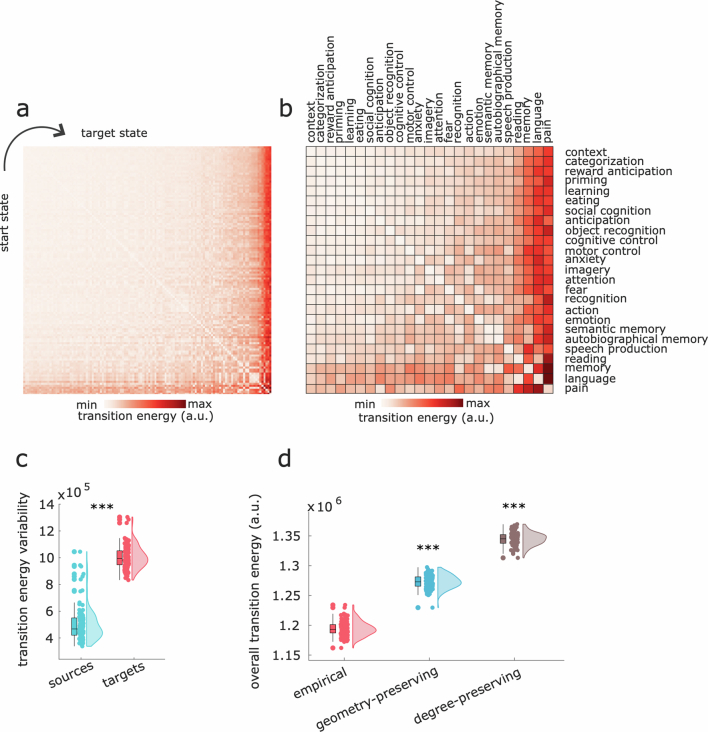
Extended Data Fig. 10. Replication in 989 HCP individuals.
(a) Transition cost (energy) between each pair of 123 cognitive topographies (‘states’) from NeuroSynth, using the consensus connectome from n = 989 HCP individuals. Rows indicate source states, columns indicate target states. (b) Transition cost between each pair of a subset of 25 out of 123 NeuroSynth states, shown for visualisation purposes. Matrices are sorted by increasing cost across both rows and columns. (c) Variability (standard deviation) of transition energy is greater along the column dimension (target states) than along the row dimension (source states), for each combination of n = 123 cognitive topographies; t(244) = 46.39, p < 0.001, Cohen’s d = 5.89. Box-plots: center line, median; box limits, upper and lower quartiles; whiskers, 1.5× interquartile range; ***, p < 0.001 from independent-samples t-tests (two-sided). (d) Overall transition energy (averaged across all transitions between 123 cognitive topographies) for each individual (n = 989), based on the individual SC network, and the corresponding degree- and cost-preserving network null models. Empirical vs geometry-preserving: t(988) = 112.12, p < 0.001, Cohen’s d = 2.47. Empirical vs degree-preserving: t(988) = 306.60, p < 0.001, Cohen’s d = 13.80. Box-plots: center line, median; box limits, upper and lower quartiles; whiskers, 1.5× interquartile range; ***, p < 0.001 from paired-samples t-tests (two-sided). Source data are provided as a Source Data file.

